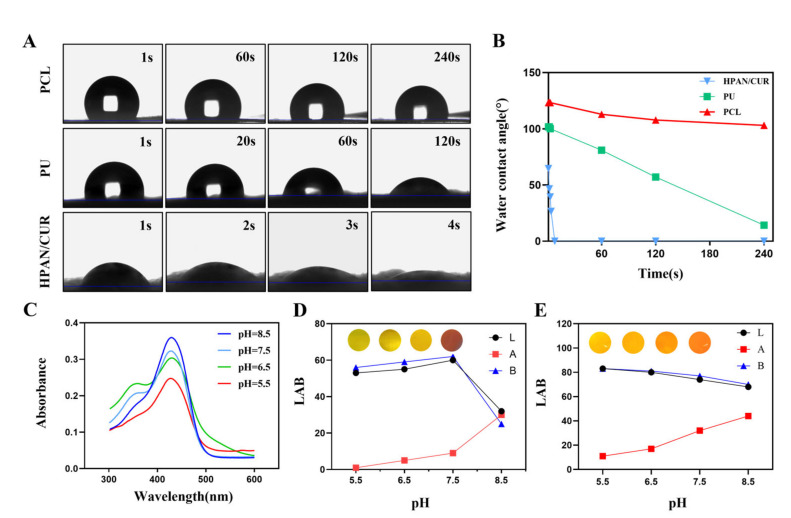
Figure 2.
(A,B) The photos and values of water contact angle of PCL, PU, HPAN/CUR in different time points. (C) Absorbance of 8% curcumin solution at different pH values. (D) Color photos and LAB values of 8% curcumin solution at different pH values. (E) Color photos and LAB values of trilayer dressing at different pH values. (LAB: The values of the three channels L, A, and B represent the color of the picture).

