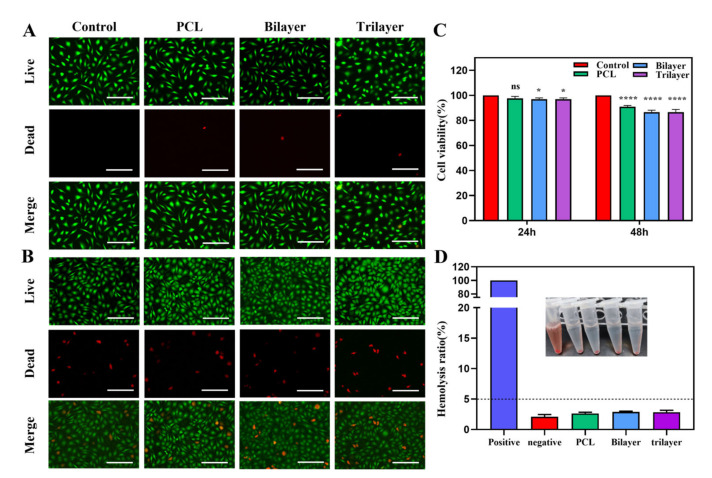
Figure 4.
(A) The Live/Dead staining of control, PCL, bilayer, and trilayer on 24 h. (B) The Live/Dead staining of control, PCL, bilayer, and trilayer on 48 h. (C) Cell viability of control, PCL, bilayer, and trilayer on 24 h and 48 h (n = 3, ns = not significance. * p < 0.05, **** p < 0.0001 compared with control group, mean ± SD). (D) Hemolysis ratio of control, negative, PCL, bilayer, and trilayer (n = 3). Scale bars are 100 µm in (A,B).

