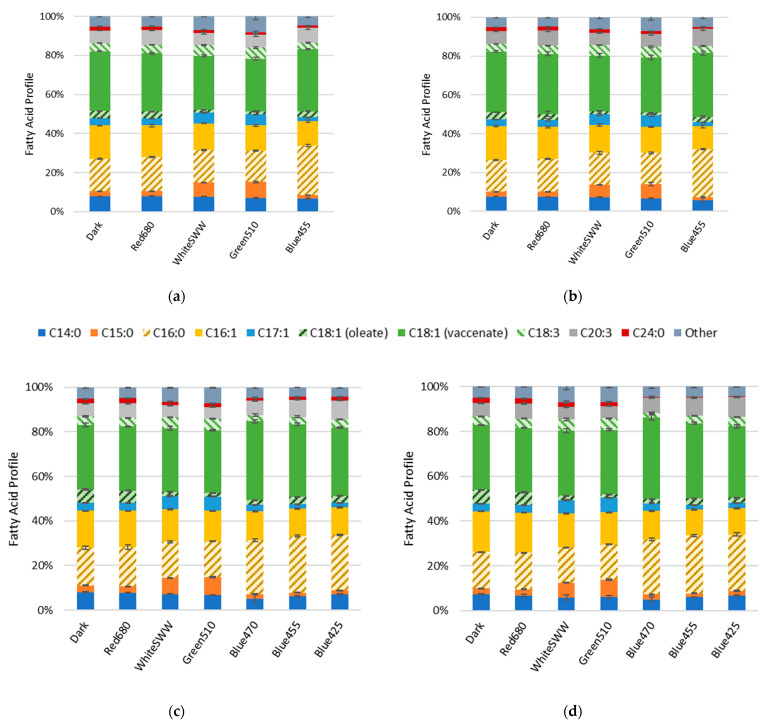
Figure 3.
Fatty acid profiles of R. erythropolis at 236 W s−2 illumination with white (standard warm white), blue (425, 455 and 470 nm), green (510 nm) and red (680 nm) light as well as a control (n = 3). “Other” constitutes fatty acids with a representation below 2% of total fatty acid content (w/w), and include C14:1, C17:0, C18:0, C20:1, C20:5, C22:1. (a) Fatty acid profile collected at 40 h, (b) at 122 h, (c) at 40 h, (d) and at 94 h.

