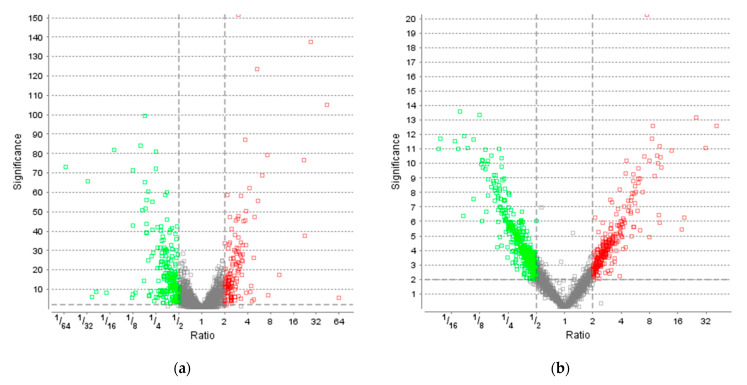
Figure 4.
Volcano plots of proteins extracted from cultures grown under LED light compared to the control. Analysis was performed based on label-free quantification (LFQ). The significance is plotted against the fold change ratio. The non-axial vertical lines denote fold change thresholds of 2 (upregulated ≥ 2 in red and downregulated ≤ 0.5 in green), the non-axial horizontal lines denote a significance threshold of 2. Figure compiled by PEAKS Studio Xpro. (a) Volcano plot after 40 h. (b) Volcano plot after 122 h.

