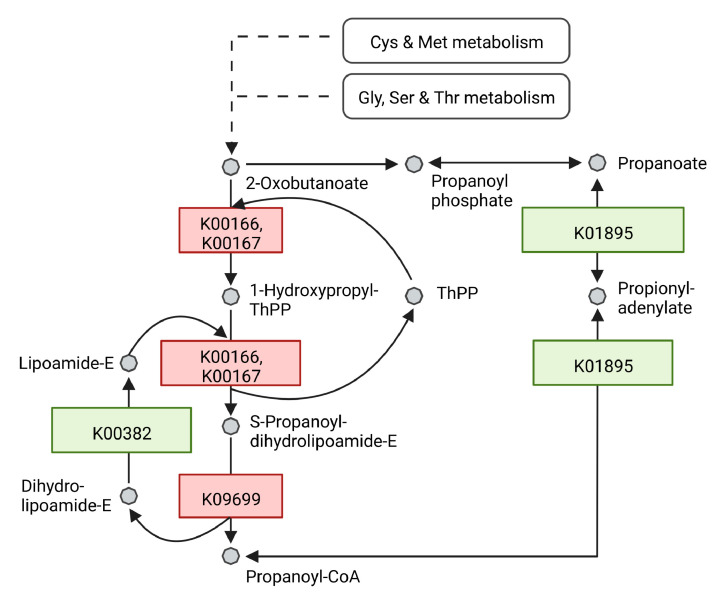
Figure 5.
Schematic illustration of an excerpt from the propanoate metabolism in R. erythropolis. After 40 h of growth, proteins which are at least 2-fold upregulated by light stimulation are depicted in red, proteins downregulated at least 2-fold are depicted in green. Each enzyme is represented with its respective KO identifier. Cys = Cysteine, Met = Methionine, Gly = Glycine, Ser = Serine, Thr = Threonine. Adapted from KEGG pathway 00640 Propanoate metabolism. Created with BioRender.com.

