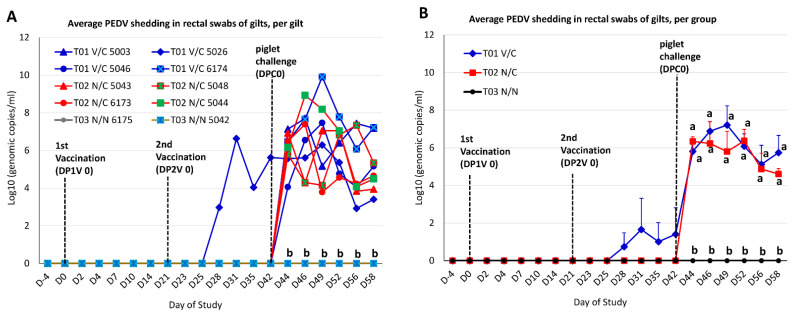
Figure 2.
PEDV shedding in rectal swabs of gilts as determined by a quantitative PEDV N gene-based RT-PCR. (A) The virus titers in individual gilts at each time point. (B) The virus titers at each time point were the mean values of the gilts (both PCR positive and PCR negative gilts) in each group. Different letters indicate significant differences.

