FIGURE 3.
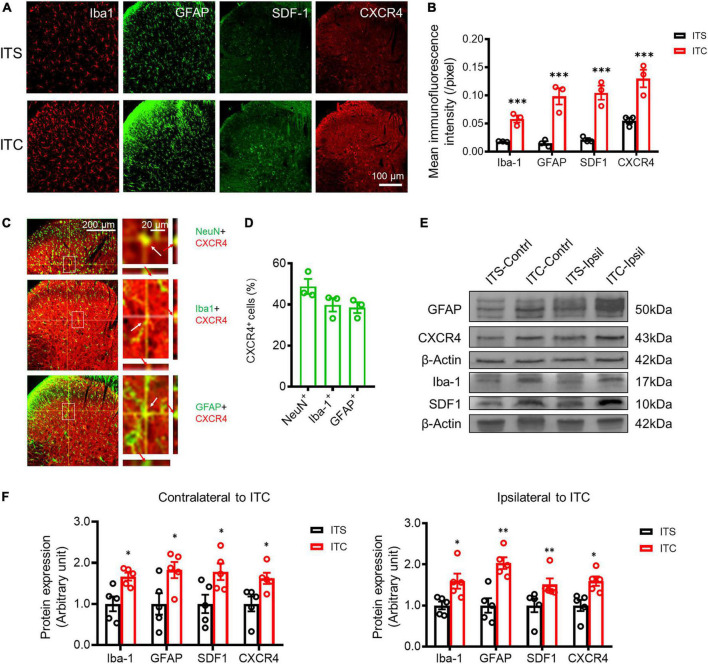
Secondary neuroinflammation in the spinal dorsal horn 7 days after ITS or ITC. (A) Representative immunofluorescent photomicrographs showing the expression of Iba-1, GFAP, SDF1, and CXCR4 at the spinal dorsal horn contralateral to ITS or ITC. (B) Quantification of the mean immunofluorescent intensity of Iba-1, GFAP, SDF1, and CXCR4-labeled cellular profiles. ***p < 0.001 ITC vs. ITS, n = 3 rats/group. (C) Representative immunofluorescent photomicrographs showing co-localization of CXCR4 with NeuN, Iba-1, and GFAP-labeled cellular profiles at the spinal dorsal horn contralateral to ITC by orthogonal viewing method. (D) The percentage of CXCR4 in NeuN, Iba-1, and GFAP-labeled cellular profiles. (E) Western blot assay of Iba-1, GFAP, SDF1, and CXCR4 in bilateral dorsal spinal cord 7 days after ITS or ITC. (F) Quantitative analysis of the Western blot results for Iba-1, GFAP, SDF1, and CXCR4 in bilateral dorsal cord following 7 days after ITS or ITC. *p < 0.05, **p < 0.01, ITC vs. ITS, n = 5 rats/group.

