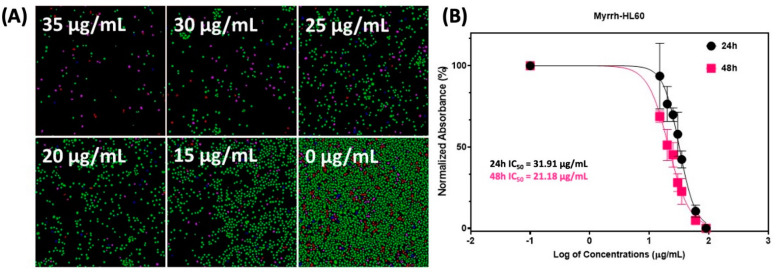
Figure 3.
Treatment of leukemic HL60 cell line with myrrh extract. (A) High content imaging of treated cells at 48 h. The cell health module was used to identify live (green), pre-apoptotic (blue), post-apoptotic (pink), and dead (red) cells. (B) Cell viability was assessed by TiterGlo™ assay at 24 h and 48 h. Five points, i.e., 35, 30, 25, 20, and 15 µg/mL serial dilution, were used to calculate the IC50 values (shown in the figure). The X-axis presents the log of myrrh concentration in µg/mL, and the Y-axis represents the percentage cell viability.

