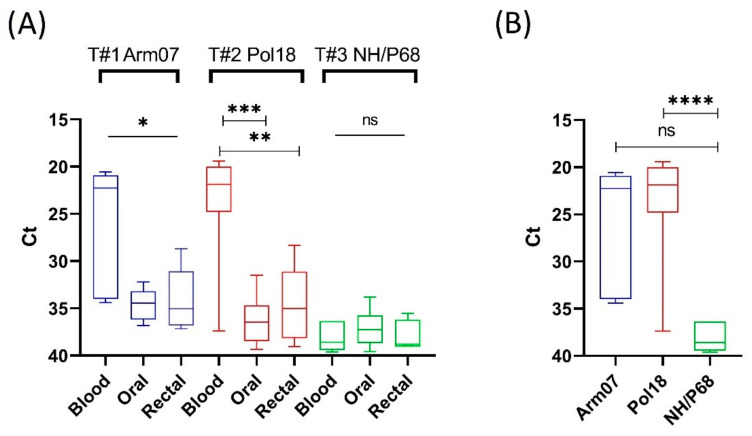
Figure 1.
(A) Statistical analysis of mean Ct values in different matrices within respective trial groups. (B) Statistical analysis of mean Ct value recorded in blood between virulent and attenuated strains; * statistically significant (T1, blood vs. oral and rectal swabs, p = 0.0335 and p = 0.0450, respectively), ** statistically significant (T2, blood vs. rectal swabs, p = 0.0011), *** statistically significant (T2, blood vs. oral swabs, p < 0.0001), **** statistically significant (Pol18 vs. NH/P68, p = 0.004), ns—not significant. The boxes represent the 50% between the 25 and 75% quartiles. The line inside the box indicates the median. The top and bottom lines denote maximum and minimum values.

