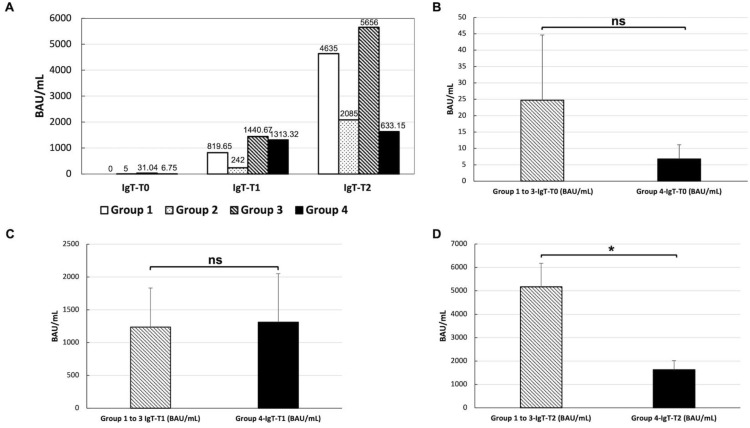
Figure 4.
Anti-SARS-CoV-2-IgG levels at T0, T1, and T2 in patients treated with different immunosuppression levels (A). Group 1: no therapy; group 2: low-level immunosuppression (i.e., hydroxychloroquine alone); group 3: medium-level immunosuppression (i.e., azathioprine, methotrexate, prednisone < 20 mg/die, ciclosporin, belimumab given in monotherapy); and group 4: high-level immunosuppression (i.e., prednisone > 20 mg/die, mycophenolate mofetil, cyclophosphamide, combination therapy). Comparison between anti-SARS-CoV-2-IgG levels between anti-SARS-CoV-2-IgG levels between patients with no treatment to medium treatment (i.e., group 1 to 3) and with high treatment (i.e., group 4). No significant difference (ns) was found at T0 [t(19) = 0.84; p = 0.41] (B) nor at T1 [t(36) = −0.22; p = 0.82]] (C) between the two groups of patients. A significant difference between the two groups (*) was found at T2 [t(22) = 3.41; p < 0.002], showing higher anti-SARS-CoV-2-IgG levels for the patients with no treatment to medium treatment (i.e., group 1 to 3) compared with patients with high treatment (D).

