. 2019 Dec 20;2(3):1059–1065. doi: 10.1039/c9na00528e

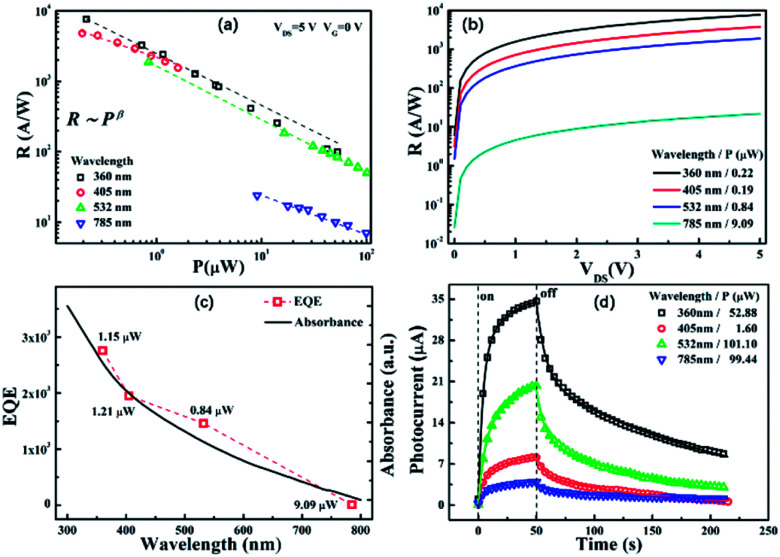
Fig. 4. (a) Relationships of responsivity and radiant flux (RP) for different light sources. The responsivity data are abstracted from the output characteristics. Dots are the experimental data and dashed lines are the fitting curves with power functions; (b) responsivities as a function of VDS (RVDS, VG = 0) for different light sources, each with the lowest intensity; (c) absorbance spectrum of the graphene–BP film and the spectral distribution of EQE of the graphene–BP phototransistor; (d) dynamic behavior of the photocurrent at a VG of 0 V and a VDS of 0.1 V for different light sources each with the highest intensity and an illumination duration of 50 s.

Fig. 4