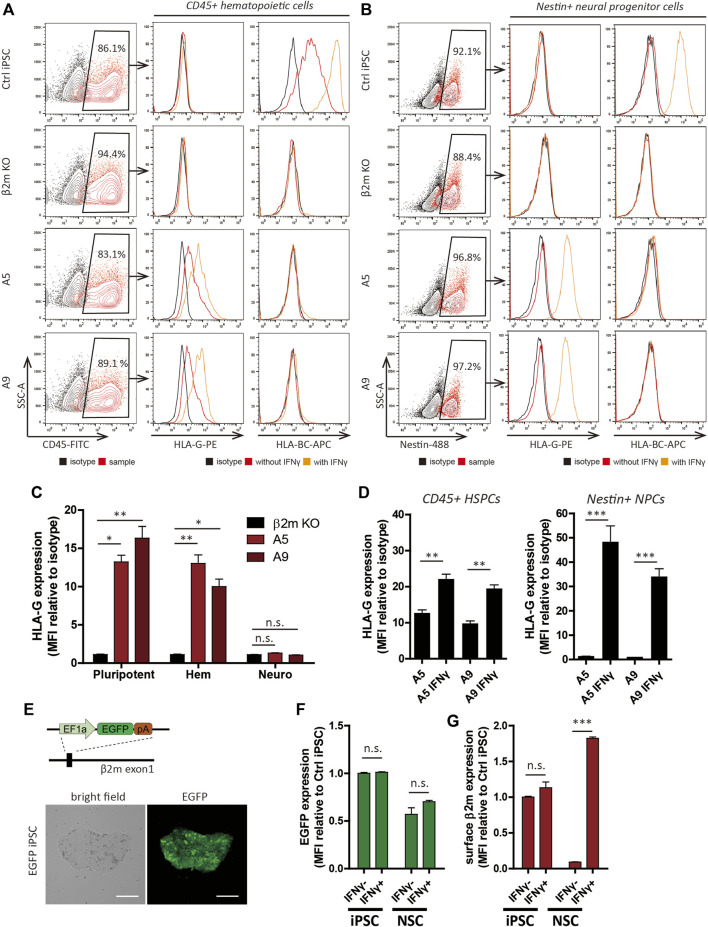
FIGURE 3.
Differentiation and HLA expression profiles of hypoimmunogenic cell lines. (A,B) Characterization of CD45+ hematopoietic progenitors (A) and nestin+ neural progenitor cells (B) derived from the cell lines. HLA-G and HLA-BC expression patterns with (orange) or without (red) IFN-γ, determined by flow cytometry. (C,D) Relative MFI of HLA-G compared to the isotype control (n = 3). MFI of pluripotent cells (pluripotent), CD45+ hematopoietic lineage cells (Hem), Nestin+ neural lineage cells (Neuro) under control ((C), n = 3) and IFN-γ-treated ((D), n = 4) conditions. (E) Schematic of generation of the EGFP cell line (upper) and light and fluorescence micrographs. Scale bar, 250 μm. (F,G) EGFP expression patterns in EGFP cells (F) and surface β2m expression patterns in WT cells (G) of iPSCs and NSCs with or without IFN-γ by flow cytometry (n = 3). Data are means ± SEMs. N.s., not significant. *p < 0.05, **p < 0.01, ***p < 0.001.

