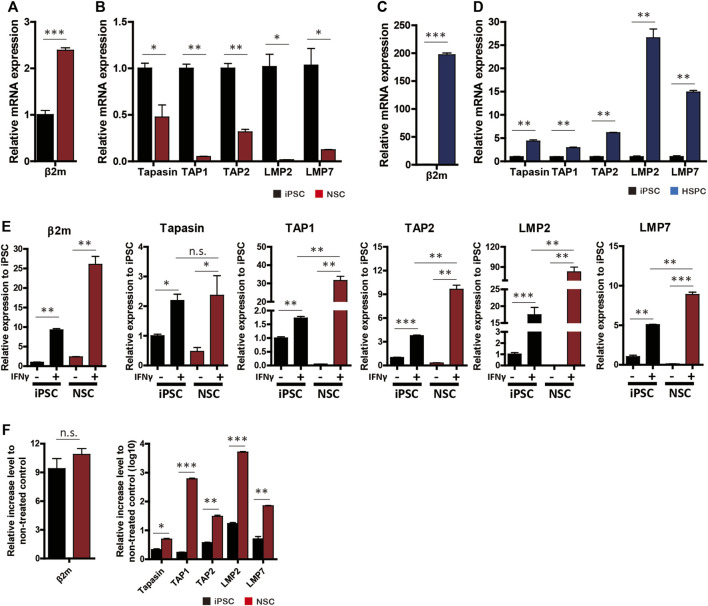
FIGURE 4.
APM gene expression profiles. (A–D) mRNA levels of β2m and APM genes (tapasin, TAP1, TAP2, LMP2, and LMP7) in neural-lineage cells (A,B) and hematopoietic-lineage cells (C,D) in comparison with iPSCs (n = 4). (E) β2m and APM expression patterns in iPSCs and NSCs in response to 48 h of IFN-γ treatment (n = 4). (F) Rate of increase in gene expression after IFN-γ treatment (n = 4). Data are means ± SEMs. n.s., not significant. *p < 0.05, **p < 0.01, ***p < 0.001.

