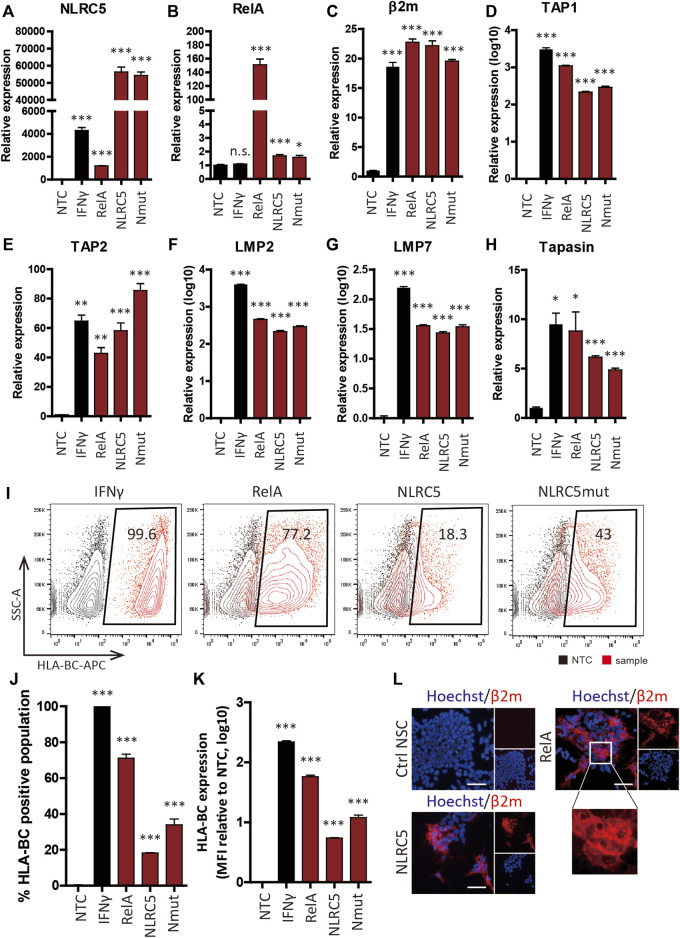
FIGURE 5.
Upregulation of APM gene expression and HLA class I molecule surface presentation by transcription factors. (A–H) Relative mRNA levels in non-transfected control (NTC), IFN-γ-treated (IFN-γ), RelA-transfected (RelA), NLRC5-transfected (NLRC5), and constitutive mutant form of NLRC5-transfected (Nmut) NSCs (n = 4). (I) Representative flow cytometry plot of surface HLA-BC presentation. (J,K) Percentage HLA-BC-positive populations (J) and MFI values compared to NTCs (K), (n = 4). (L) Immunocytochemistry of β2m surface presentation in response to transcription factors. Magnified image shows β2m on the cell surface; all images are fluorescence micrographs. Scale bar, 50 μm. Data are means ± SEMs.

