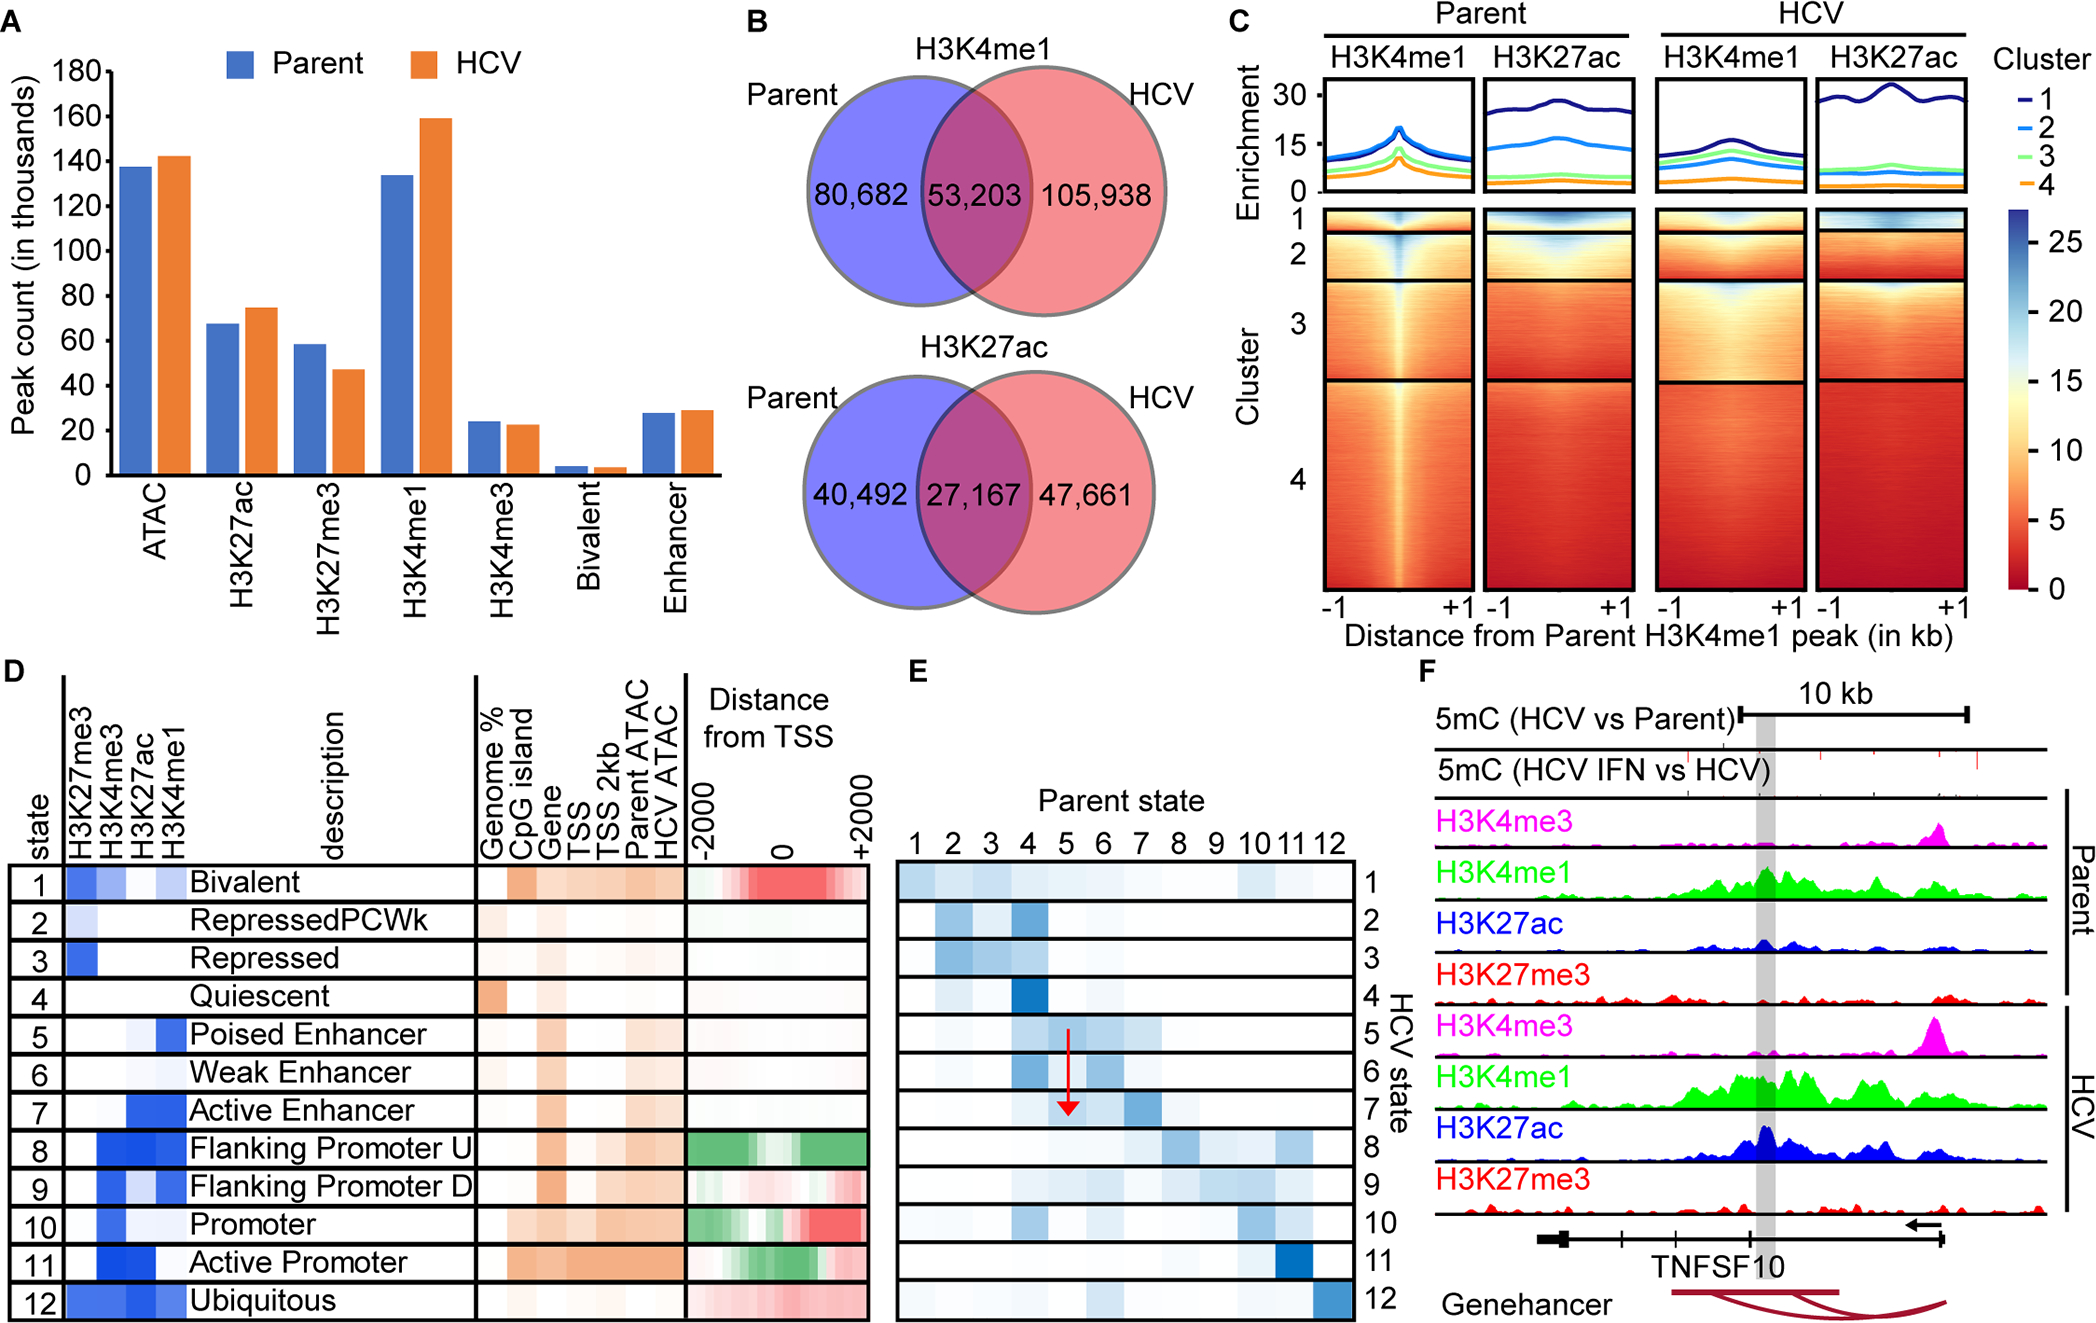
Fig. 3: Enhancers are enriched targets for epigenetic changes induced by HCV.

(A) A bar chart of MACS called peaks for H3K4me3, H3K4me1, H3K27ac, and H3K27me3. (B) Venn diagrams demonstrating the overlap between H3K4me1 and H3K27ac peaks in parent versus HCV infected Hu1545 cells. (C) A deeptools heatmap of enhancer regions defined by combined parent and HCV peak summits for H3K4me1. Four clusters are shown based on the combination of histone marks across parent (left two panels) and HCV (right two panels). Higher enrichment for the noted histone mark is colored in blue. (D) ChromHMM modeling of four histone marks with twelve states with a description of their regulatory function. Darker blue represents higher enrichment of that mark within the called state. (E) A heatmap displaying the changes in ChromHMM states between parent and HCV Hu1545 cells in the called states in part D. The blue color represents high conservation between the given states. A red arrow is shown to highlight the transition from State 5 (poised enhancer) in the parental line to State 7 (active enhancer) in HCV-infected cells. (F) A UCSC browser shot of the TNSF10 locus demonstrating a gain of active enhancers (as denoted by both gains in H3K4me1 and H3K27ac as well as the Genehancer annotation) identified by ChromHMM.
