. 2020 Jun 9;2(8):3156–3163. doi: 10.1039/d0na00046a

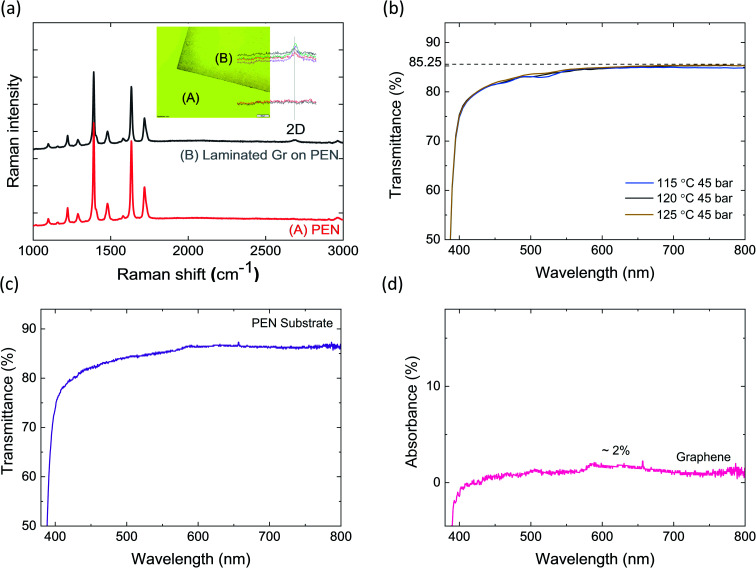
Fig. 4. (a) Raman spectra measured on a laminated area on several samples (B) and Raman spectra measured on PEN on the non-laminated area (A). The 2D peak of graphene is only visible in the laminated area (B). Inset shows the two different areas on a sample along with Raman peaks in several points in A and B regions. (b) Transmittance as a function of wavelength for different samples. 120 °C 45 bar (black), 115 °C 45 bar (blue), and 125 °C 45 bar (yellow) in the visible spectrum wavelength. (c) Transmittance as a function of wavelength for PEN substrate. (d) Absorbance of graphene laminated on the substrate obtained by deconvoluting substrate contribution (c) from total transmittance (b).

Fig. 4