. 2021 Jun 4;3(14):4106–4118. doi: 10.1039/d0na00910e

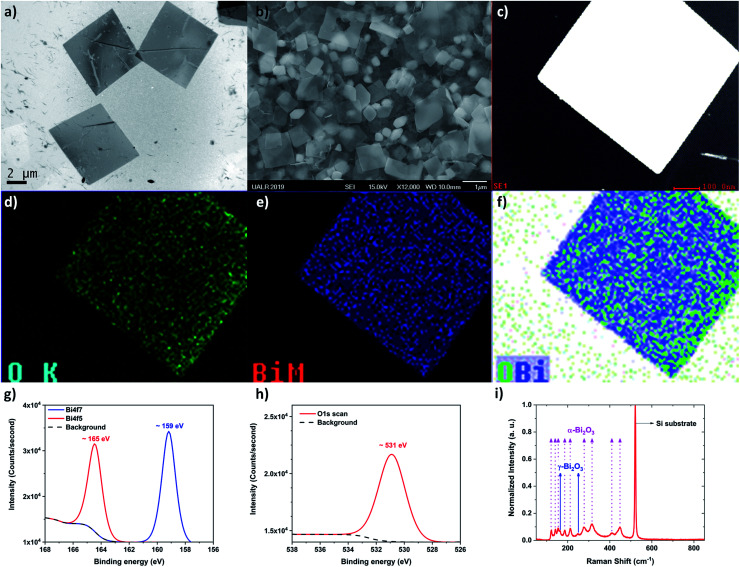
Fig. 3. Bismuth oxide flakes obtained at high fluence (∼160 J cm−2) (a) Low-magnification TEM image acquired by using the JEOL JEM2100F at 80 kV. (b) Low magnification SEM image acquired by using the JEOL JSM7000F at 15 kV. (c) Typical STEM image of a flake, (d) oxygen chemical mapping on the flake, (e) bismuth mapping on the flake, and (f) chemical mapping displaying the bismuth and oxygen mapping together. The TEM used to acquire those images was the JEOL JEM2100F at 80 kV, (g) XPS spectra display the bismuth peaks Bi4f7 and Bi4f5 scan, (h) XPS spectra displaying the oxygen peak, (i) Raman spectra confirming that two crystalline phases of bismuth oxide (α and γ, see texts for details) are produced during the PLAL synthesis.

Fig. 3