Figure 6.
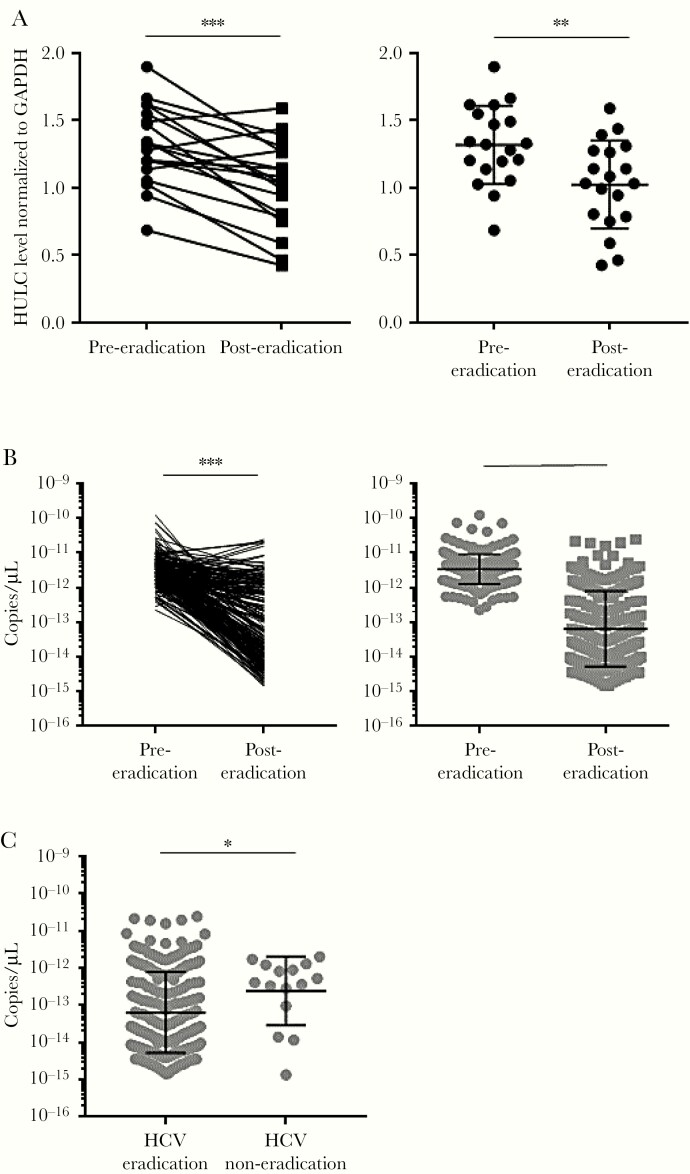
HULC levels in human liver and blood. A, Total RNA was isolated from liver samples of 19 patients at pre– and post–hepatitis C virus (HCV) eradication. HULC and glyceraldehyde 3-phosphate dehydrogenase (GAPDH) RNA levels in human liver were quantified by reverse-transcription quantitative polymerase chain reaction (RT-qPCR). HULC levels were normalized to those of GAPDH RNA. Differences in HULC levels between pre- and posteradication were analyzed by a paired t test (left) and Mann–Whitney test (right). The left panel shows paired levels in individual patients and the right panel shows nonpaired levels for all patients. The bars show geometric mean with geometric standard deviation (SD). B, Total RNA was isolated from blood samples of 213 patients at pre- and post-HCV eradication. HULC levels in blood per microliter were quantified by RT-qPCR. The left panel shows paired levels in individual patients and the right panel shows nonpaired levels for all patients. The bars show geometric mean with geometric SD. Differences in HULC levels between pre- and post-eradication were analyzed by a paired t test (left) and Mann–Whitney test (right). C, Total RNA was isolated from blood samples of 15 patients in whom HCV eradication was unsuccessful and 213 patients with successful HCV eradication at postantiviral treatment. HULC levels in blood per microliter were quantified by RT-qPCR. The bars show geometric mean with geometric SD. Differences in HULC levels between HCV-eradicated and HCV-noneradicated patients were analyzed by Mann–Whitney test. *P < .05, **P < .01, ***P < .001.

