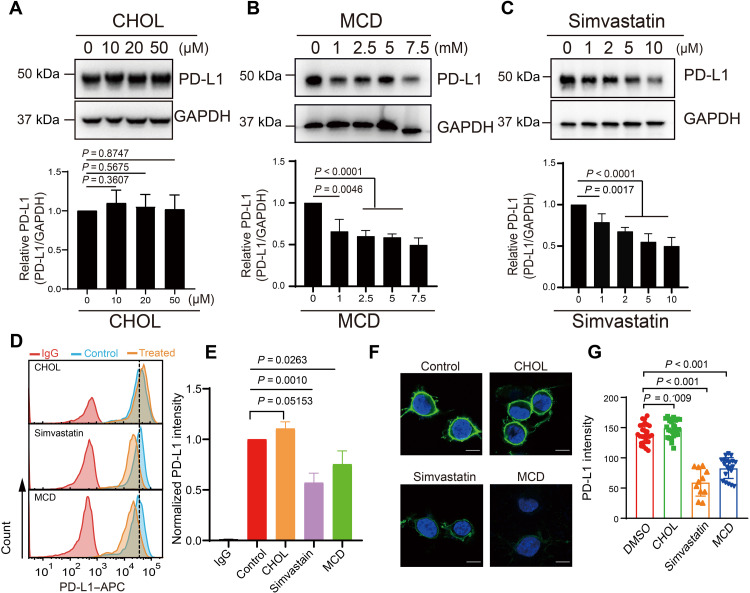
Fig. 1. Cholesterol maintains the stability of PD-L1.
(A to C) RKO cells were treated with several concentrations of cholesterol (CHOL, 0 to 50 μM for 12 hours), MCD (0 to 7.5 mM for 6 hours), or simvastatin (0 to 10 μM for 12 hours). Western blot was performed to measure PD-L1 expression in response to each treatment (top). The intensity of PD-L1 expression (relative to GAPDH) was quantified with ImageJ (bottom). Data shown are the means ± SD (n = 3). P values were calculated using unpaired two-sided Student’s t test. (D and E) Flow cytometric analysis of PD-L1 expressed on the cell surface after treatment with CHOL (25 μM for 12 hours), MCD (5 mM for 6 hours), or simvastatin (10 μM for 12 hours) (D). Levels of PD-L1 were quantified with FlowJo (E). Expression data are shown as fold change values relative to the control and indicate the means ± SD (n = 3). P values were calculated with one-way ANOVA. (F and G) Immunofluorescence staining shows PD-L1 in RKO cells treated with CHOL (25 μM for 12 hours), MCD (5 mM for 6 hours), or simvastatin (10 μM for 12 hours). PD-L1 was labeled with anti–PD-L1 antibody (green), and the cell nucleus was stained with DAPI (blue) (F). Scale bars, 10 μm. Fluorescence intensities were then quantified (G); n = 26, 27, 11, and 21 for control, cholesterol, simvastatin, and MCD treatments, respectively. Statistical differences were determined with one-way ANOVA. All results are representative of three independent experiments.

