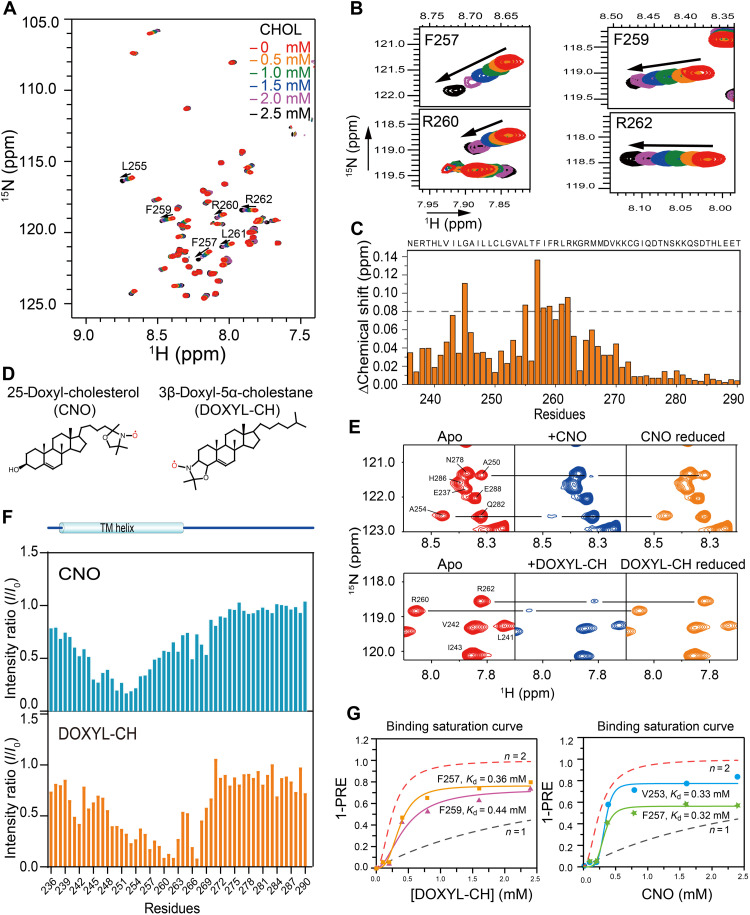
Fig. 3. Characterization of cholesterol binding sites in PD-L1-TC.
(A) Superimposed 2D 1H, 15N-TROSY-HSQC spectra of 0.2 mM 15N-labeled PD-L1-TC were acquired at 700 MHz (1H frequency) and 310 K in the presence of cholesterol at 0 mM (red), 0.5 mM (orange), 1.0 mM (green), 1.5 mM (blue), 2.0 mM (purple), or 2.5 mM (black). (B) Enlarged view of four regions in the plot displayed in (A), showing specific chemical shift perturbations with cholesterol titration of the two CRAC motifs (CRAC1: F257 and R260; CRAC2: F259 and R262) (right). (C) NMR chemical shift changes of PD-L1-TC after the addition of 1.5 mM cholesterol in DMPC/DH6PC bicelles. The plot shows chemical shift changes between the spectra of PD-L1-TC with or without cholesterol. (D) Chemical structures of CNO (left) and DOXYL-CH (right) are shown on in the topmost panel. (E) PRE (I/I0) effects of different nitroxide-labeled cholesterols (DOXYL-CH and CNO) on PD-L1-TC in DMPC/DH6PC bicelles. Specific broadening of 1H-15N correlation peaks by 2.4 mM CNO and DOXYL-CH and intensity recovery of the broadened peaks with the addition of ascorbic acid are shown in the middle and bottom panels, respectively. (F) PRE (I/I0) analysis of CNO and DOXYL-CH. The addition of 2.4 mM CNO showed obvious PRE effects at L252 to A254, whereas addition of 2.4 mM DOXYL-CH caused the most notable PRE effects at R260 to R262. I, peak intensity in the presence of the paramagnetic agent; I0, peak intensity in the absence of the paramagnetic agent. (G) Comparison of (1-PRE) caused by DOXYL-CH (left) and CNO (right) with simulated binding curves. For the PRE data, PD-L1-TC NMR samples were titrated with 0, 0.1, 0.2, 0.4, 0.8, 1.6, and 2.4 mM DOXYL-CH and CNO, respectively. The simulated binding curves with n = 1 (no cooperativity, dotted black line) and n = 2 (positive cooperativity, dotted red line) are shown in each diagram, respectively.

