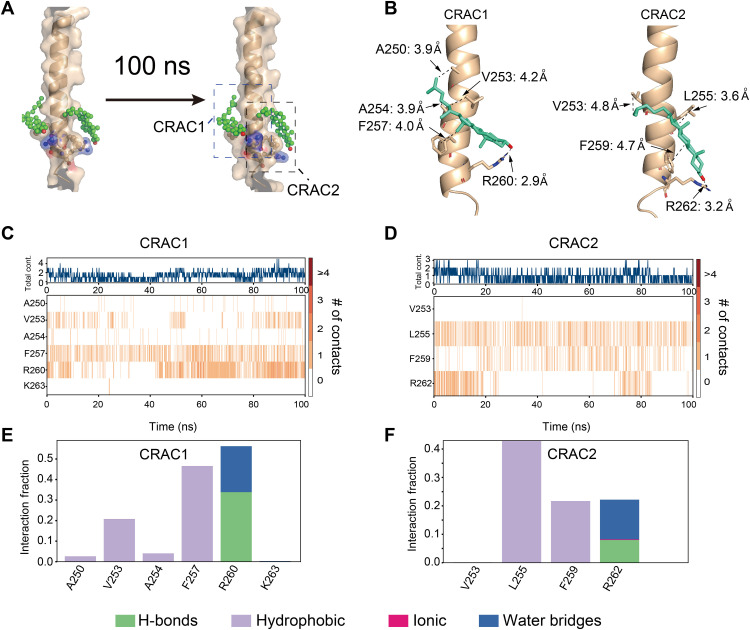
Fig. 4. Evaluation of the NMR-derived cholesterol binding site with MD simulation.
(A) Models showing the positions of cholesterol and PD-L1-TC over the MD simulation trajectory (0 ns, left to 100 ns, right). CRAC1 and CRAC2 are the key motifs in PD-L1 that interact with cholesterol (green). (B) Detailed description of the interactions between CRAC1 and CRAC2 on PD-L1-TC and cholesterol (green) from the final snapshot of MD simulations. (C and D) The binding heatmap shows that cholesterol mainly interacts with the CRAC1 (C) and CRAC2 (D) motifs in PD-L1-TC through the whole trajectory. The orange lines show the number of contacts between cholesterol and PD-L1-TC. (E and F) Quantification of heatmap intensity showing the number of contacts for CRAC1 and CRAC2 motifs. Cholesterol interacts with the CRAC1 motif mainly through hydrophobic interactions with V253 and F257 and through hydrogen bond and water bridges with R260 (E). Cholesterol interacts with the CRAC2 motif mainly through hydrophobic interactions with L255 and F259 and through hydrogen bonds and water bridges with R262 (F).

