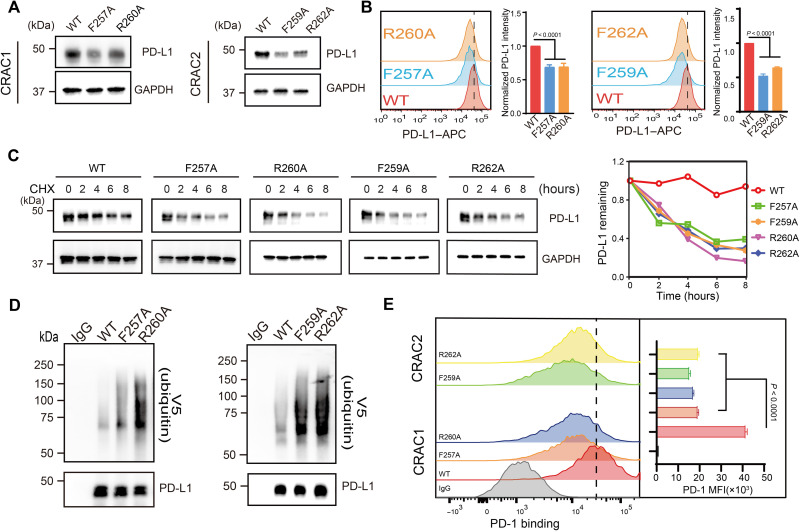
Fig. 5. CRAC motifs are critical for the interaction between PD-L1 and cholesterol.
(A) Cellular levels of exogenous PD-L1WT, PD-L1F257A, PD-L1F259A, PD-L1R260A, and PD-L1R262A in endogenous PD-L1–knockdown RKO stable cells were analyzed using Western blot. (B) Flow cytometric analysis of membrane PD-L1WT, PD-L1F257A, PD-L1F259A, PD-L1R260A, and PD-L1R262A in endogenous PD-L1–knockdown RKO stable cells. Bar graphs depict the fold change relative to the control; values shown are the means ± SD from four independent experiments (n = 4). Statistical differences were determined with one-way ANOVA. (C) CHX-chase assay showing the degradation of PD-L1WT and mutants. RKO stable cells expressing PD-L1WT, PD-L1F257A, PD-L1F259A, PD-L1R260A, and PD-L1R262A were treated with 50 μM CHX for 2, 4, 6, or 8 hours, and then, PD-L1 was detected by Western blot (shown on the left). The intensity of relative PD-L1 protein (PD-L1 remaining) was quantified using ImageJ analysis (shown on the right). Two independent experiments were performed with similar results. (D) Ubiquitination levels of wild-type PD-L1 (PD-L1WT) and the mutant proteins PD-L1F257A, PD-L1F259A, PD-L1R260A, and PD-L1R262A in HEK293FT cells. Ubiquitination levels were measured with V5 immunoblotting after immunoprecipitation with anti–PD-L1 antibody. Two independent experiments were performed with similar results. (E) Flow cytometry detection of PD-1 binding in RKO stable cells expressing PD-L1WT, PD-L1F257A, PD-L1F259A, PD-L1R260A, or PD-L1R262A. The y axis indicates PD-1 mean fluorescence intensity (MFI). Data are shown as the means ± SD from three independent experiments (n = 3). Statistical differences were determined with one-way ANOVA.

