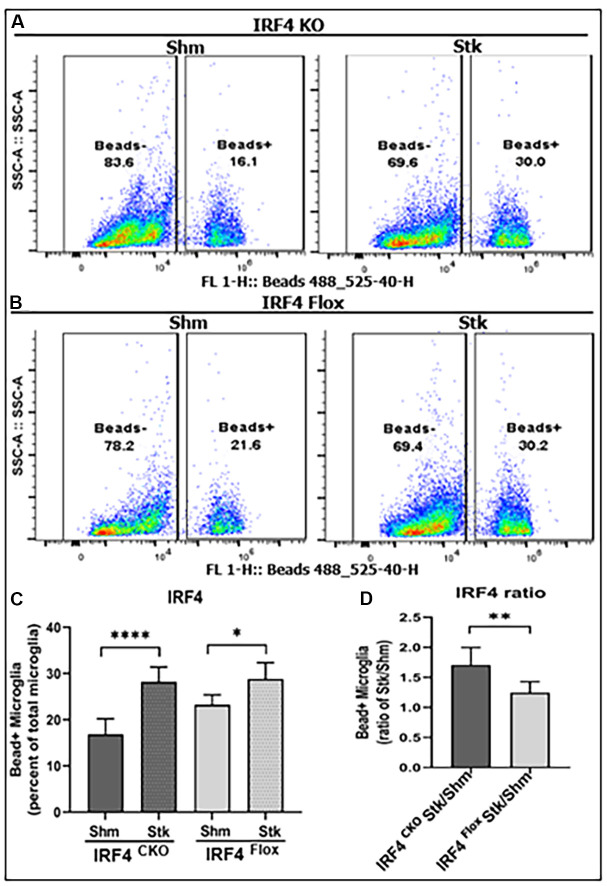
Figure 4.
Microglial phagocytosis by flow cytometry performed on IRF4 CKO stroke and sham mice. Quantification data are presented as mean percentage of bead+ microglia. (A, B) Fluorescence intensity plots for IRF4 KO and flox microglia exposed to FITC fluorescent bioparticles. (C) Percentage fluorescence of phagocytosis in IRF4 CKO vs. flox sham and stroke microglia; and (D) comparative quantified data for the ratio of IRF4 CKO stk/shm vs. IRF4 flox stk/shm in (C). n = 4 to 5 per sham and 6 to 7 per stroke group; *P < 0.0500, **P < 0.0010, ***P < 0.0001.

