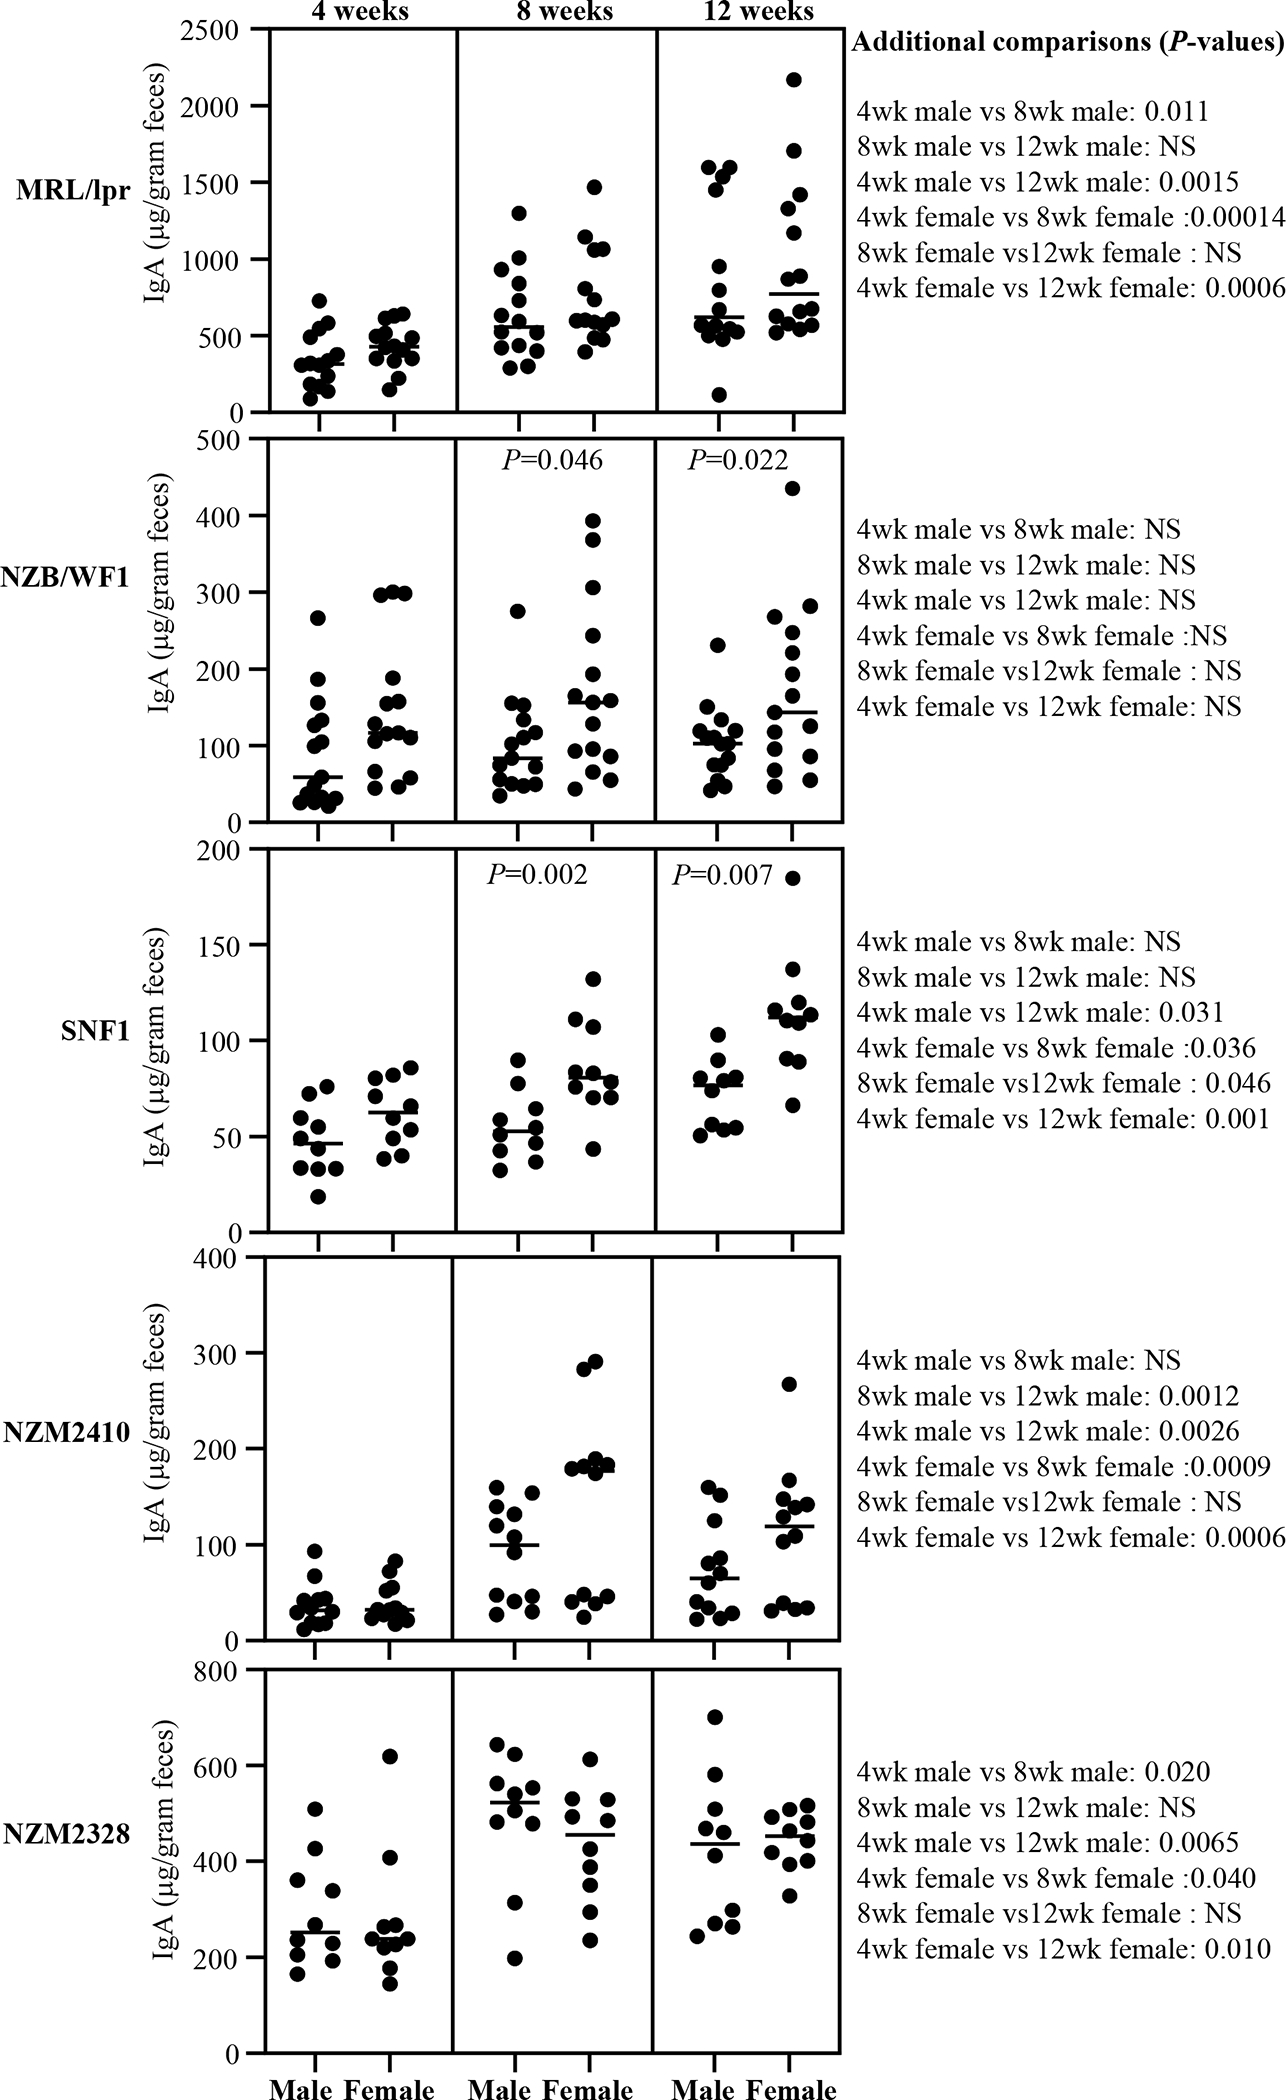
Figure 1: Abundance of IgA in the feces of lupus-prone mouse strains.

Fecal samples were collected from individual mice of indicated strains at 4, 8 and 12 weeks of age and subjected to ELISA to determine the IgA concentrations as detailed under materials and method section. IgA concentrations per gram feces are shown. n= 14 males and 14 females for MRL/lpr, 15 males and 15 females for NZB/WF1, 10 males and 10 females for SNF1, 12 males and 12 females for NZM2410, and 10 males and 10 females for NZM2328 strains. P-value (by Mann-Whitney test) of male vs female comparisons are shown within the graph. P-values of other comparisons are shown on the right.
