. 2019 Jul 11;1(9):3307–3324. doi: 10.1039/c9na00280d

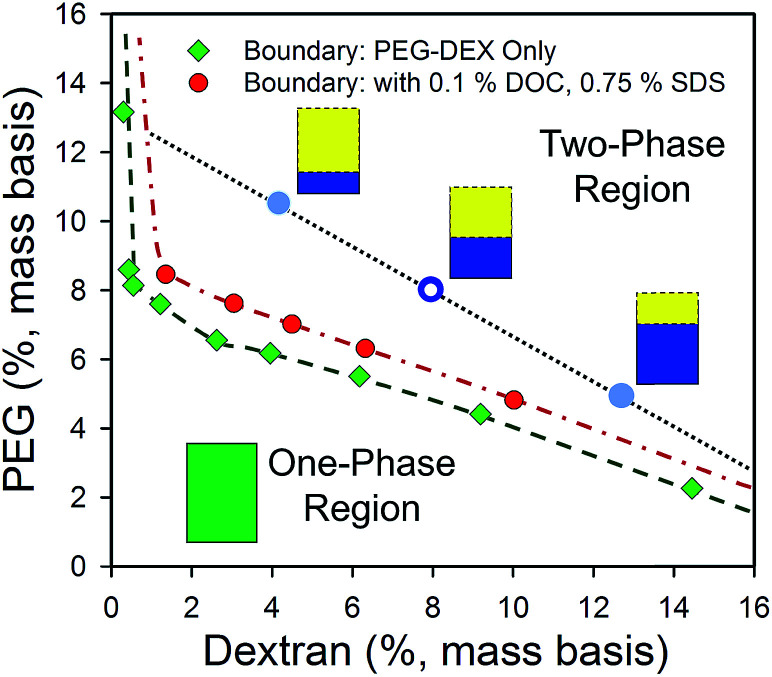
Fig. 1. Phase diagram of a 6 kDa PEG and dextran 70 ATPE system in water determined by the cloud point method22 without (green diamond symbols) or in the presence of surfactants (red filled circles) at room temperature (≈21 °C). Compositions of PEG and DEX within the two-phase region, such as at the open blue circle, will at equilibrium form two phases at compositions located along the coexistence curve (dashed green eyeguide/dot-dash red eyeguide), and connected by a tie-line (black dotted eyeguide). In the PEG–dextran ATPE system the upper phase is PEG-rich phase, and the lower phase is dextran-rich. All initial compositions along a tie-line produce identical composition of the two phases, but at different volume ratios due to mass conservation (e.g. schematic volumes at the blue filled circles). The red circles report the coexistence curve, also called the binodal, of the polymers in the presence of 0.1% (mass basis) DOC and 0.75% (mass basis) SDS, which shifts the coexistence curve to slightly greater polymer mass fractions. Most conditions encountered in the use of surfactant-ATPE for SWCNTs will display similar coexistence curves.

Fig. 1