. 2019 Jul 11;1(9):3307–3324. doi: 10.1039/c9na00280d

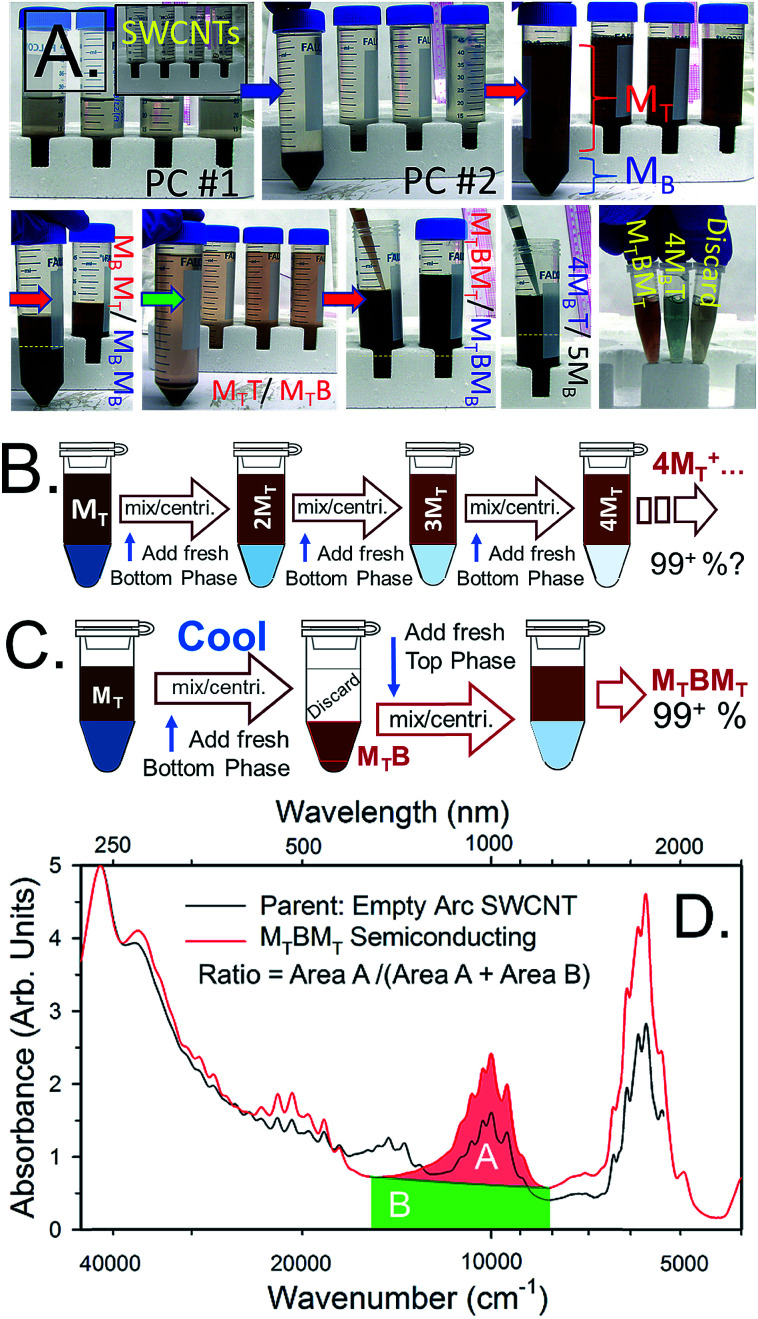
Fig. 4. (A) Photographs of water-filled electric arc synthesis SWCNTs being separated on the basis of semiconducting and metallic electrical properties from start to finish. The separation conditions for the semiconducting/metallic separation in the in the 3rd, 4th and 6th photos were 0.7% SDS, 0.9% SC and (4 to 5) μL mL−1 1/100th conc. NaClO. After separation, the red-orange-colored semiconducting SWCNTs primarily reside in the top phase, and the blue-green metallic SWCNTs primarily in the bottom phase. The photos are representative of the SWCNT concentration at which the separation is typically conducted in our labs. (B) A possible workflow for increasing semiconducting purity of the top fraction by repeatedly performing ATPE steps to remove contaminant metallic SWCNTs to fresh bottom phase. (C) A recommended replacement workflow in which a temperature change is used to shift all of the SWCNTs into a fresh bottom phase before application of a second, partitioning, ATPE step (back at room temperature). (D) Absorbance spectra of the semiconducting empty electric arc SWCNT synthesis SWCNTs separated as in (A) (red line) compared to the parent dispersion (black line). Absorbance features due to metallic SWCNT such as the peak features around ≈700 nm in the parent dispersion are near completely removed after the separation. The filled areas highlight the integrated regions of the absorbance spectra used for semiconducting purity assessment in literature methods.15 The ratio of A/(A + B) as measured over the shown wavenumber range (8110–15 575) cm−1 is 0.426.

Fig. 4