. 2022 Aug 26;11:e76846. doi: 10.7554/eLife.76846

Figure 2. Bacterial growth profiling.

(A) Three growth parameters calculated from growth curves. The lag time (τ), the growth rate (r), and the saturated population size (K) are indicated. (B) Distributions of the three parameters. The numbers of medium combinations (N) used are indicated. (C) Principal component analysis (PCA) of medium combinations. The contributions of PC1 and PC2 are shown. (D) Correlations of the three parameters to PC1 and PC2. Spearman’s correlation coefficients and the p values are indicated.

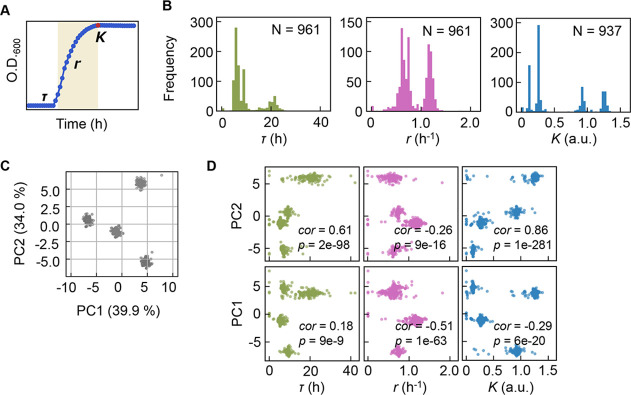
Figure 2—source data 1. Medium combinations used in the growth assay.
elife-76846-fig2-data1.xlsx (260.1KB, xlsx)

Figure 2.

Figure 2—figure supplement 1. Clustering of the medium combinations.

Figure 2—figure supplement 1.

(A) Clusters of medium combinations. (B) Distributions of lag time (τ), growth rate (r), and saturated population size (K) coloured by the four clusters.
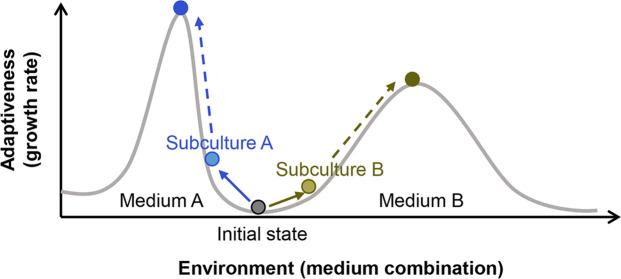
Figure 2—figure supplement 2. Illustration of the fitness landscape.

Figure 2—figure supplement 2.

Two fitness distributions in media A and B are shown as an example. Colour variation of circles represent the differentiation in cell populations.
Figure 2—figure supplement 3. Subculture of the E. coli cell population used in the growth assay.

Figure 2—figure supplement 3.

The growth curves, the calculated growth rates, and maximal population size are shown from left to right panels. Blue, green, and yellow indicate the daily transfer of subculture for three times (days). Standard errors of replications are indicated.