. 2022 Aug 26;11:e76846. doi: 10.7554/eLife.76846

Figure 4. Contribution of the components to bacterial growth.

(A) Relative contributions of the components to the three parameters predicted by gradient-boosted decision tree (GBDT). 10 components with large contributions to the three parameters of lag time (τ), growth rate (r), and saturated population size (K) are shown in order. The remaining 31 components are summed as ‘Others’. (B) Correlation of the concentrations of the components with the growth parameters. The components with the largest contributions to the three parameters τ, r, and K are shown individually. Spearman’s correlation coefficients and the p values are indicated.

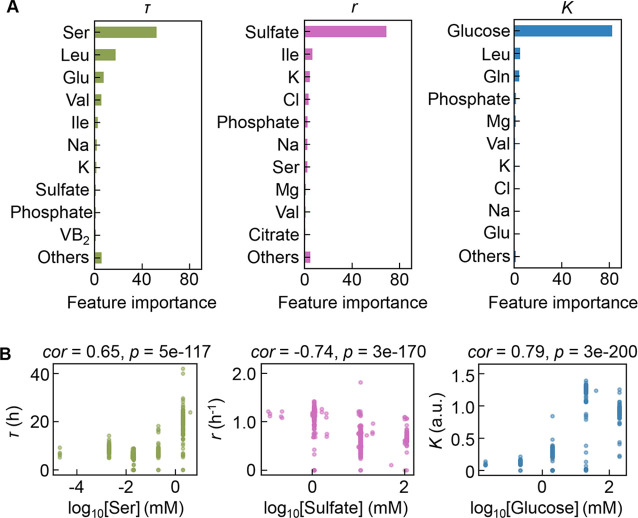
Figure 4—source data 1. Summary of the feature importance of the components for τ, r, and K.

Figure 4.

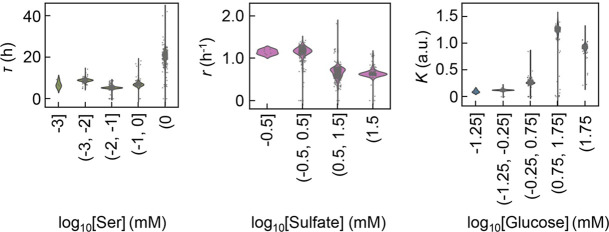
Figure 4—figure supplement 1. Violin plots of the growth parameters at varied ranges of chemical concentrations.

Figure 4—figure supplement 1.

The chemical components with the largest contributions to the three parameters lag time (τ), growth rate (r), and saturated population size (K) are shown individually. The concentration gradients of the three chemicals were divided into four or five ranges, as shown on the horizontal axes.
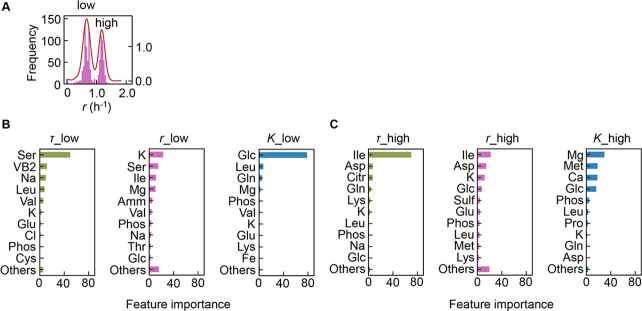
Figure 4—figure supplement 2. Separation of the multimodal distribution of growth rate (r).

Figure 4—figure supplement 2.

The continuous probability distribution of the multimodal distribution of r (A) determined by Gaussian kernel density estimation is indicated by the red lines. The two separated distributions (datasets) are indicated as low and high. Gradient-boosted decision tree (GBDT) predictions of the low (B) and high (C) distributions are shown. 10 components with large contributions to the three parameters lag time (τ), r, and saturated population size (K) are shown in order. The remaining 31 components are summed as ‘Others’.
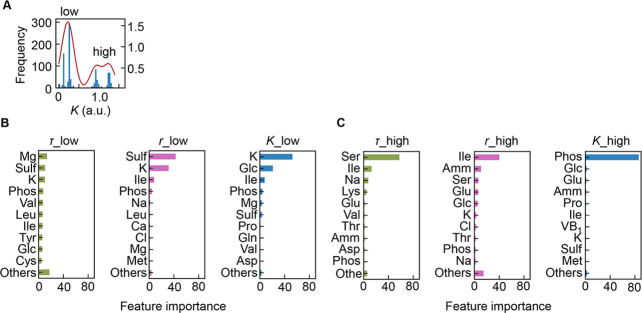
Figure 4—figure supplement 3. Separation of the multimodal distribution of saturated population size (K).

Figure 4—figure supplement 3.

The continuous probability distribution of the multimodal distribution of K (A) determined by Gaussian kernel density estimation is indicated by the red lines. The two separated distributions (datasets) are indicated as low and high. Gradient-boosted decision tree (GBDT) predictions of the low (B) and high (C) distributions are shown. 10 components with large contributions to the three parameters lag time (τ), growth rate (r), and K are shown in order. The remaining 31 components are summed as ‘Others’.
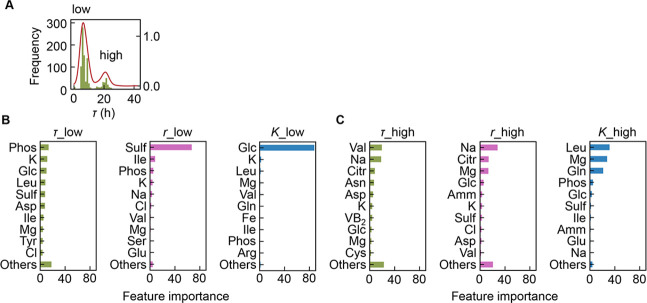
Figure 4—figure supplement 4. Separation of the multimodal distribution of lag time (τ).

Figure 4—figure supplement 4.

The continuous probability distribution of the multimodal distribution of τ (A) determined by Gaussian kernel density estimation is indicated by the red lines. The two separated distributions (datasets) are indicated as low and high. Gradient-boosted decision tree (GBDT) predictions of the low (B) and high (C) distributions are shown. 10 components with large contributions to the three parameters τ, growth rate (r), and saturated population size (K) are shown in order. The remaining 31 components are summed as ‘Others’.