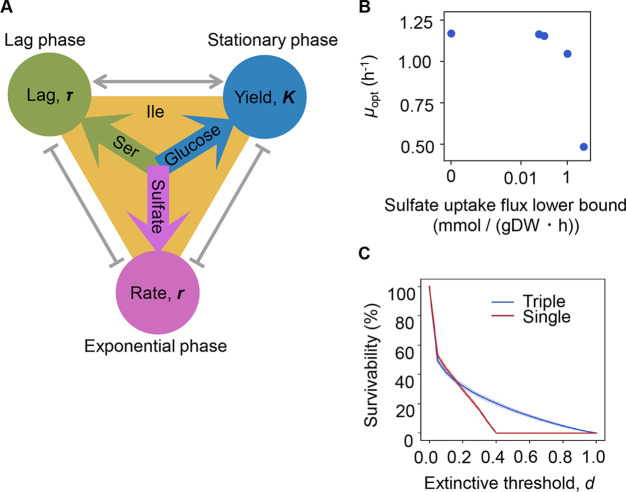
Figure 6. Growth strategy of risk diversification.
(A) Schematic drawing of the decision-making components for bacterial growth. (B) Flux balance analysis (FBA) simulation. The predicted growth rates are plotted against the input rate of sulfate uptake. (C) Theoretical simulation of survival probability. The blue and red lines represent the growth strategies of the multiple and single decision makers, respectively. The shading covering the red and blue lines indicates the SD.

