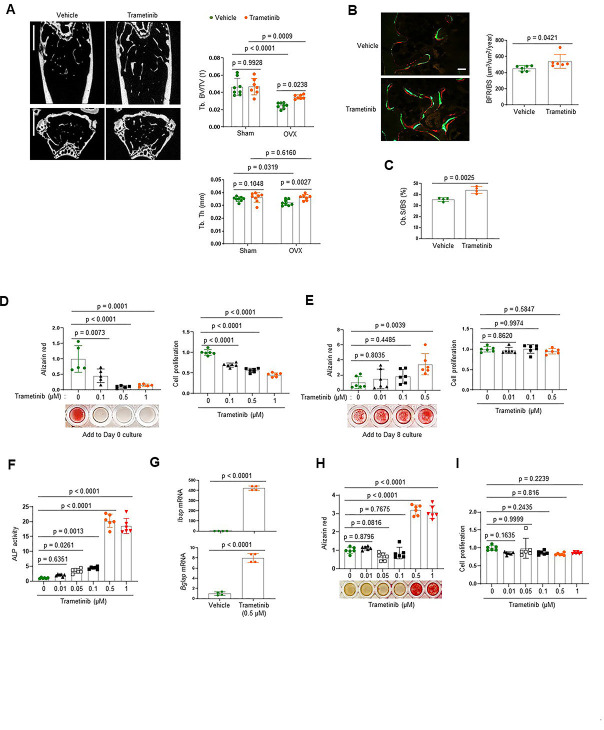
Figure 1. The extracellular signal-regulated kinase (ERK) mitogen-activated protein kinase (MAPK) pathway plays biphasic roles in osteogenesis.
(A–C) Twenty-week-old female mice were treated with vehicle or trametinib after either Sham or ovariectomy (OVX) surgery. Representative microCT images of the femoral bone (A, left) and quantification of relative trabecular bone volume/total volume (Tb. BV) and thickness (Tb. Th, A, right) are displayed. Alternatively, dynamic histomorphometry analysis of the femoral bones was performed to assess in vivo osteoblast activity in OVX group. Representative images of calcein/alizarin labeling (B, left) and quantification of bone formation rate (BFR)/bone surface (BS, B, right) and osteoblast surface (Ob.S)/bone surface BS, (C) are displayed. Scale bars, 1 mm (A), 50 µm (B). Human bone marrow-derived mesenchymal stromal cells (BMSCs) were treated with different doses of trametinib at days 0 (D) or 8 (E) of osteogenic culture. Mineralization and cell proliferation were assessed by alizarin red and alamar blue staining after 14 days of culture, respectively. (F–I) Mouse wildtype osteoblasts (Obs) were treated with different doses of trametinib at day 0 of osteogenic culture and 6 days later, alkaline phosphatase (ALP) activity (F) and osteogenic gene expression by real-time PCR (G) were assessed. Mineralization by alizarin red staining (H) and cell proliferation (I) by alamar blue staining were assessed after 18 days of culture. Data are representative of three independent experiments (A) [left], (B) [left], (D–I) or pooled from two experiments (A) [right], (B) [right], (C). A two-tailed unpaired Student’s t-test for comparing two groups (A–C, G) or ordinary one-way analysis of variance (ANOVA) with Dunnett’s multiple comparisons test (D–F, H, I) (A–I; error bars, standard deviation [SD] of biological replicates).
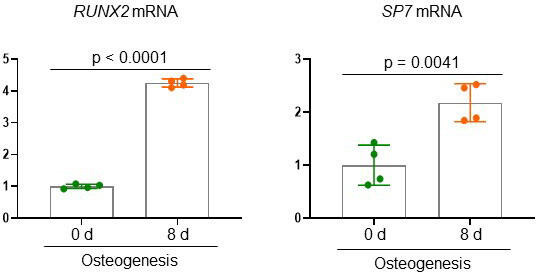
Figure 1—figure supplement 1. Osteogenic gene expression in human bone marrow-derived mesenchymal stromal cells (BMSCs).


