. 2022 Aug 17;11:e78069. doi: 10.7554/eLife.78069

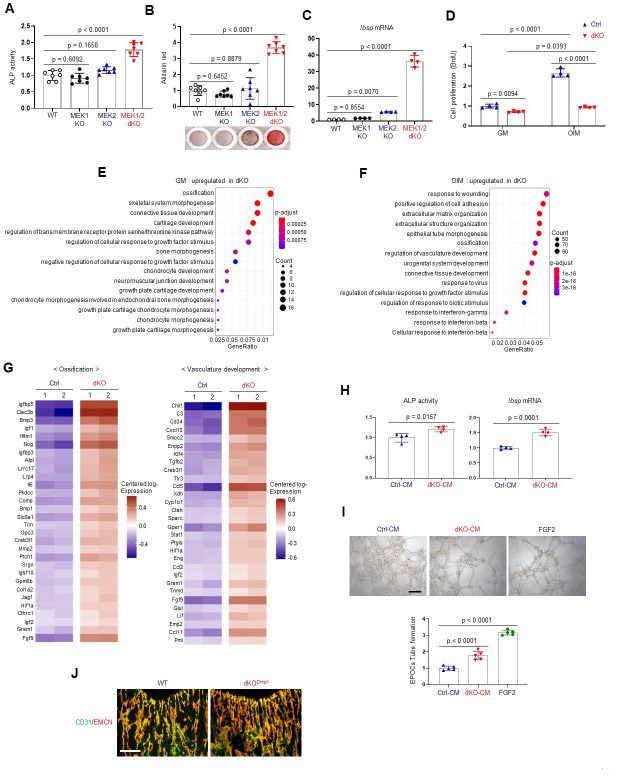
Figure 3. Effects of MEK1/2 deletion on osteoblast differentiation and production of angiogenic and osteogenic factors.

(A–C) Mouse Map2k1fl/fl;Map2k2+/+ and Map2k1fl/fl;Map2k2−/ osteoblasts (Obs) were infected with control vector or Cre recombinase-expressing lentiviruses; Map2k1fl/fl;Map2k2+/+ Obs with control (WT) or Cre (MEK1 KO), Map2k1fl/fl;Map2k2−/− Obs with control (MEK2 KO) or Cre (MEK1/2 dKO). Puromycin-selected Obs were cultured under osteogenic conditions and alkaline phosphatase (ALP) activity (A) and osteogenic gene expression (C) were determined at day 6 and mineralization (B) was analyzed at day 18 of culture. (D) MEK2 KO (Ctrl) and MEK1/2 dKO (dKO) Obs were cultured with control growth medium (GM) or osteogenic induction medium (OIM) and cell proliferation was analyzed by Bromodeoxyuridine (BrdU) incorporation at day 6 of the culture. (E, F) Transcriptome analysis of Ctrl and dKO Obs 6 days after GM or OIM culture. Biological process output of gene ontology analysis was performed in both GM and OIM group for upregulated genes in dKO relative to Ctrl Obs. The color indicates adjusted p value as estimated by the Benjamini–Hochberg method with the threshold of significance p = 0.05 and q = 0.005. (G) Heatmaps for ossification- and vasculature-associated gene expression. The top 30 upregulated genes in dKO Obs relative to Ctrl Obs are displayed as each row and column represent gene symbol and sample, respectively. The log10 expression (read count) was centered across samples and red and purple denote upregulated and downregulated, respectively. (H) Conditioned medium (CM) from Ctrl and dKO Obs was collected at day 6 under osteogenic culture and mouse wildtype bone marrow-derived mesenchymal stromal cells (BMSCs) were cultured under osteogenic condition in the presence of CM of Ctrl Obs and dKO Obs and ALP activity (left) and Ibsp mRNA level (right) were assessed at day 6. (I) Capillary tube formation of mouse endothelial cells (EPOCs) was performed in the presence of CM for 5 hr. Representative images (top) and quantification for the number of branches are displayed (bottom). FGF2 was used as a positive control. Scale bar, 200 µm. (J) Immunofluorescence for CD31 (green) and endomucin (EMCN, red) in the epiphyseal area of 8-week-old WT and dKODmp1 femurs. Scale bar, 100 µm. Data are representative of three independent experiments (A–D, H–J). For transcriptome analysis, biological duplicates were analyzed (E–G). Ordinary one-way analysis of variance (ANOVA) with Dunnett’s multiple comparisons test (A–C, I) or a two-tailed unpaired Student’s t-test for comparing two groups (D, H) (A–D, H, I; error bars, standard deviation [SD] of biological replicates).

Figure 3—source data 1. Source data for Figure 3A–D, H1.

Figure 3.

Figure 3—figure supplement 1. Characterization of MEK1/2-deficient osteoblast-lineage cells.
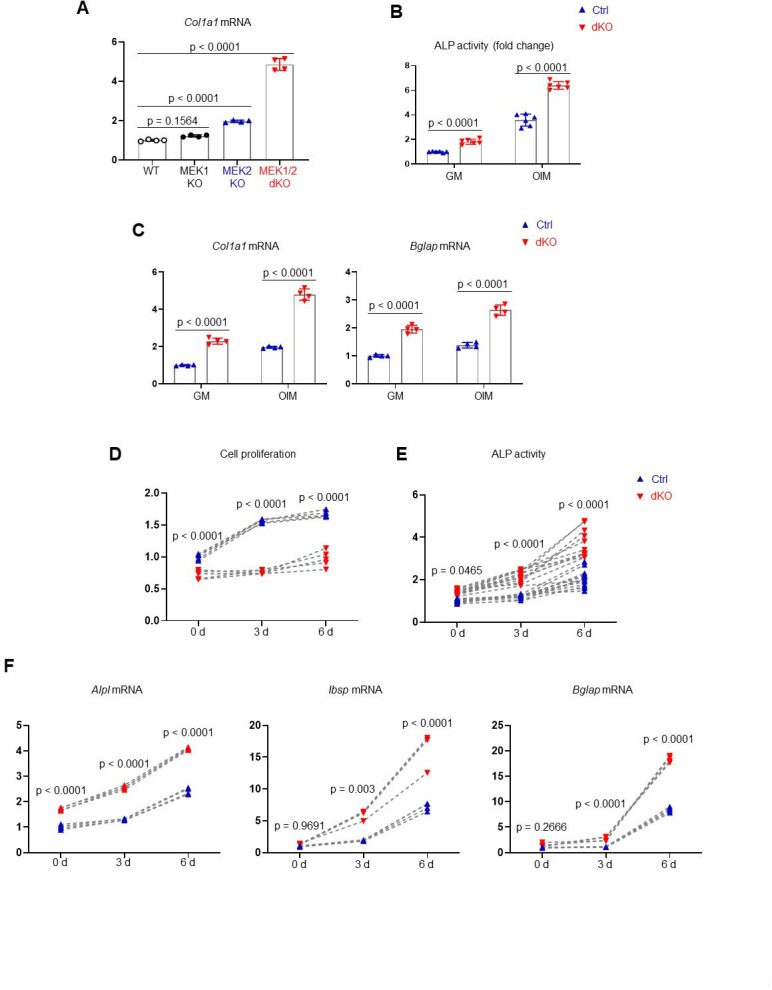
Figure 3—figure supplement 1.

(A) Mouse Map2k1fl/fl;Map2k2+/+ and Map2k1fl/fl;Map2k2−/ osteoblasts (Obs) were infected with vector or Cre recombinase-expressing lentiviruses; Map2k1fl/fl;Map2k2+/+ Obs with vector (WT) or Cre (MEK1 KO), Map2k1fl/fl;Map2k2−/− Obs with vector (MEK2 KO) or Cre (MEK1/2 dKO). Puromycin-selected Obs were cultured under osteogenic conditions and Col1a1 gene expression was determined at day 6. (B, C) Ctrl (MEK2 KO) and dKO (MEK1/2 dKO) Obs were cultured in the presence of growth medium (GM) or osteogenic induction medium (OIM) and alkaline phosphatase (ALP) activity (B) and osteogenic gene expression (C) were assessed at day 6 in culture. Cell proliferation (D), ALP activity (E), and osteogenic gene expression (F) of Ctrl and dKO Obs at days 0, 3, and 6 of the osteogenic culture were analyzed by alamar blue staining, colorimetric assay, and RT-PCR, respectively. Data are representative of three independent experiments. An ordinary one-way analysis of variance (ANOVA) with Dunnett’s multiple comparisons test (A) or a two-tailed unpaired Student’s t-test for comparing two groups (B–F) (A–F; error bars represent the standard deviation [SD] of biological replicates).
Figure 3—figure supplement 1—source data 1. Source data for Figure 3—figure supplement 1A–F.
Figure 3—figure supplement 2. Transcriptome analysis of MEK1/2-deficient osteoblast-lineage cells.
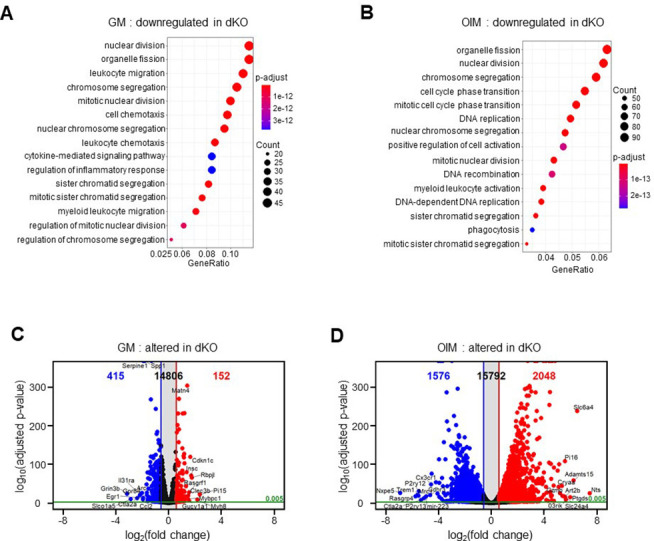
Figure 3—figure supplement 2.

(A–D) Transcriptome analysis of Ctrl and dKO Obs 6 days after growth medium (GM) or osteogenic induction medium (OIM) culture. Biological process output of gene ontology analysis was performed in both GM (A) and OIM (B) group for downregulated genes in dKO Obs relative to Ctrl Obs. The color indicates adjusted p value as estimated by the Benjamini–Hochberg method with the threshold of significance p = 0.05 and q = 0.005. Volcano plots showing the gene expression for up/downregulated genes in dKO Obs relative to Ctrl Obs after GM (C) or OIM (D) culture. Dots indicate upregulated (red) and downregulated genes (blue). The top 10 up/downregulated genes were labeled.
Figure 3—figure supplement 3. MEK1/2-deficient osteoblasts show gene enrichment of WNT and TGF-β signaling.
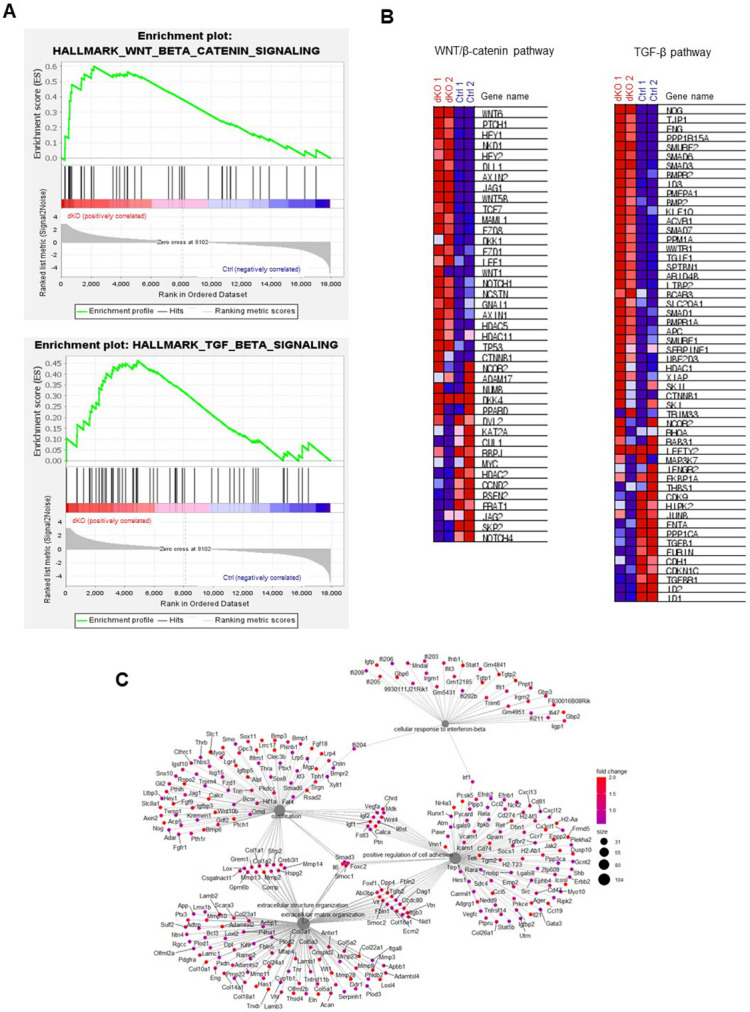
Figure 3—figure supplement 3.

(A, B) Gene set enrichment analysis (GSEA) of Ctrl and dKO Obs at day 6 of the osteogenic culture shows an enrichment of genes associated with the pathways of WNT/β-catenin and TGF-β. Enrichment plots (A) and heatmap of signature gene sets (B) are displayed. (C) Category net plot of Ctrl and dKO Obs at day 6 of the osteogenic culture shows a relationship between genes associated with the significant gene ontology (GO) term.
Figure 3—figure supplement 4. MEK1/2-deficient osteoblasts show enhanced WNT/β-catenin and TGF-β signaling at late stages of osteogenic differentiation.
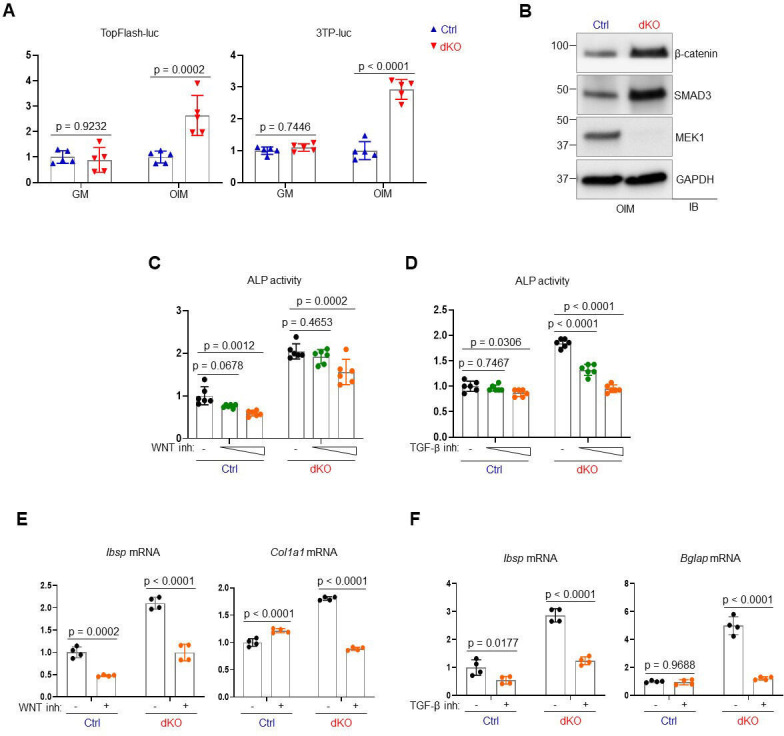
Figure 3—figure supplement 4.

(A) Ctrl and dKO Obs were cultured under growth (GM) or osteogenic conditions (OIM) for 3 days and transfected with a Topflash-luc or 3TP-luc reporter gene along with Renilla. 48 hr later, luciferase activity was measured and normalized to Renilla activity. (B) Immunoblotting analysis showing protein levels of β-catenin and SMAD3 in Ctrl and dKO Obs at day 6 of osteogenic culture (OIM). GAPDH was used as a loading control. (C–F) Ctrl and dKO Obs were cultured under osteogenic conditions in the presence of vehicle or an inhibitor against WNT or TGF-β signaling and 6 days later, alkaline phosphatase (ALP) activity (C, D) and osteogenic gene expression (E, F) were analyzed for osteogenic differentiation. A two-tailed unpaired Student’s t-test (A, E, F) or an ordinary one-way analysis of variance (ANOVA) with Dunnett’s multiple comparisons test (C, D) was used to compare groups (A, C–F; error bars represent the standard deviation [SD] of biological replicates).
Figure 3—figure supplement 4—source data 1. Source data for Figure 3—figure supplement 4A, C–F.
Figure 3—figure supplement 4—source data 2. Full immunoblots for Figure 3—figure supplement 4B.
Figure 3—figure supplement 5. Effects of MEK1/2 deletion on RUNX2 expression and transcriptional activity in osteoblasts.
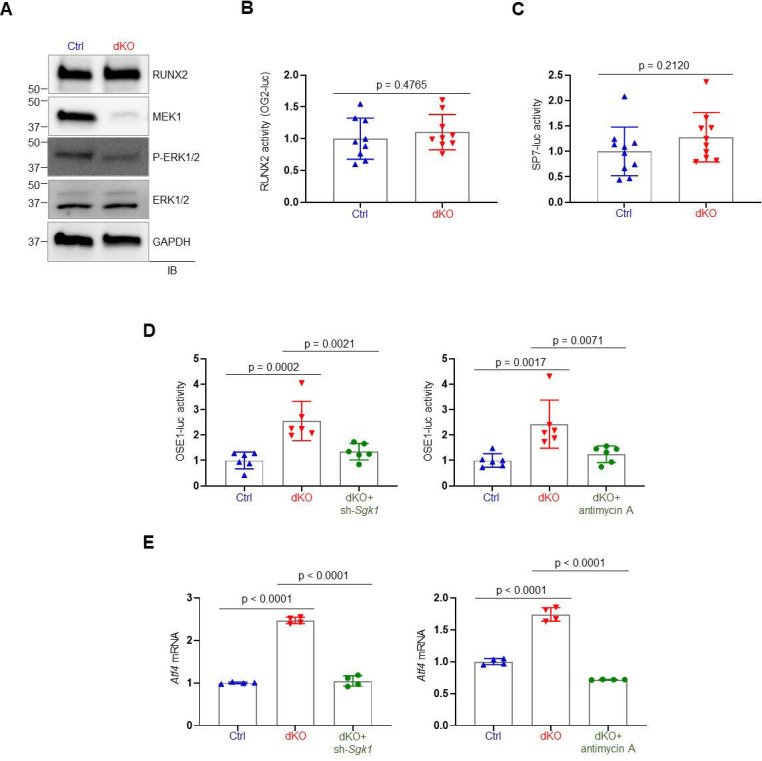
Figure 3—figure supplement 5.

(A) Immunoblotting analysis showing protein levels of RUNX2 in Ctrl and dKO Obs. GAPDH was used as a loading control. (B, C) Ctrl and dKO Obs were transfected with the OG2-luc reporter gene or SP7-responsive reporter gene along with Renilla. After 48 hr, luciferase activity was measured and normalized to Renilla activity. (D) Ctrl and dKO Obs expressing sh-Scr or sh-Sgk1 shRNAs (left) or treated with antimycin A (mitochondria inhibitor, 10 µM, right) were transfected with the ATF4-responsive reporter gene (OSE1-luc) along with Renilla. After 48 hr, luciferase activity was measured and normalized to Renilla activity. (E) Atf4 mRNA levels of Ctrl and dKO Obs expressing sh-Scr or sh-Sgk1 shRNAs (left) or treated with antimycin A (10 µM) (right) were examined at day 6 of the osteogenic culture. Data are representative of two independent experiments. A two-tailed unpaired Student’s t-test (B, C) or an ordinary one-way analysis of variance (ANOVA) with Dunnett’s multiple comparisons test (D, E) was used to compare groups (B–E; error bars represent the standard deviation [SD] of biological replicates).
Figure 3—figure supplement 5—source data 1. Full immunoblots for Figure 3—figure supplement 5A.
Figure 3—figure supplement 5—source data 2. Source data for Figure 3—figure supplement 5B–E.