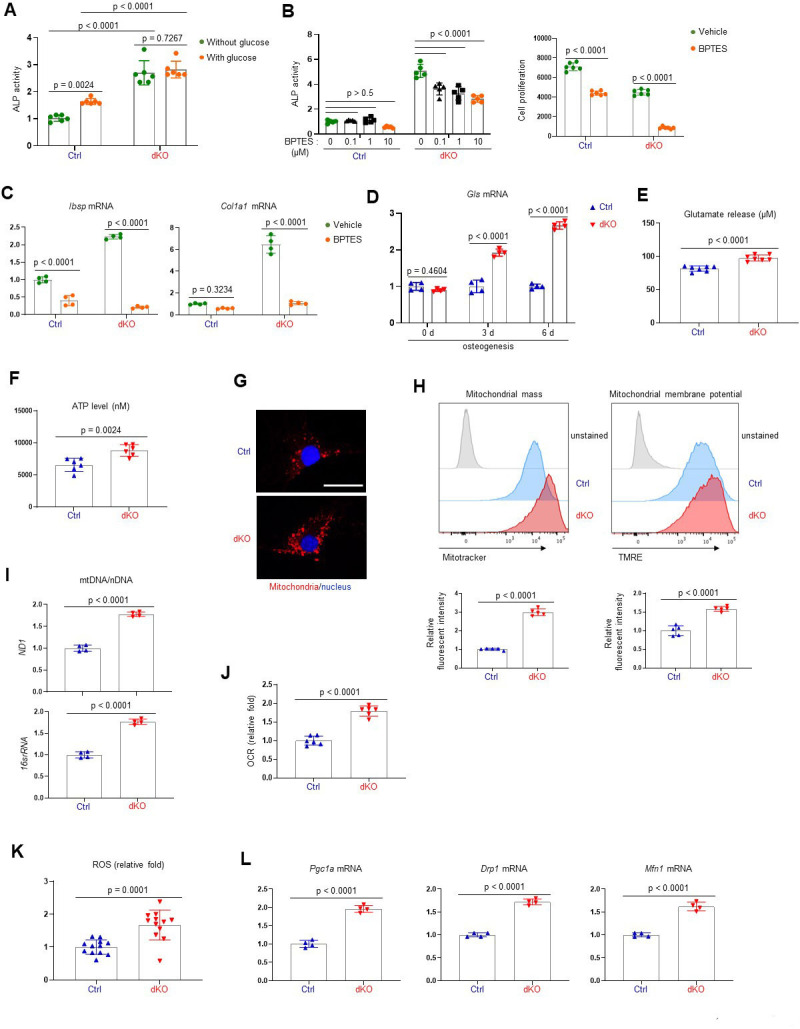
Figure 4. MEK1/2 deletion enhances mitochondria-mediated energy metabolism in osteoblasts.
(A) Ctrl and dKO Obs were cultured under osteogenic conditions in the presence or absence of glucose and 6 days later, alkaline phosphatase (ALP) activity was assessed. Ctrl and dKO Obs were treated with different doses of bis-2-[5-phenylacetamido-1,3,4-thiadiazol-2-yl]ethyl sulfide (BPTES) under osteogenic conditions and 6 days later, ALP activity and cell proliferation (B) and osteogenic gene expression (C) were assessed. mRNA levels of Gls in Ctrl and dKO Obs were measured by RT-PCR analysis at different time points of osteogenic culture (D) and levels of glutamate in the supernatant were measured for extracellular glutamate release at day 6 culture of osteogenesis (E). (F–I) Intracellular adenosine triphosphate (ATP) levels (F), mitochondrial numbers (G), and the ratio of mitochondrial DNA (mtDNA, mt-ND1 or mt-16sRNA) to nuclear DNA (nDNA, Hk2) (I) were assessed in Ctrl and dKO Obs after 6 days of culture. Alternatively, flow cytometry was used to measure mitochondrial numbers and membrane potential of Ctrl and dKO Obs treated with Mitotracker or TMRE at day 4 of osteogenic culture, respectively (H). Numbers indicate median fluorescence intensity (H, bottom). Scale bar, 75 µm (G). (J) Oxygen consumption rate (OCR) in Ctrl and dKO Obs 6 days after osteogenic culture. (K) Intracellular reactive oxidative species (ROS) levels in Ctrl and dKO Obs were assessed 6 days after osteogenic culture. (L) mRNA levels of mitochondria-related genes in Ctrl and dKO Obs were assessed by RT-PCR analysis. Data are representative of three independent experiments. A two-tailed unpaired Student’s t-test for comparing two groups (A, B) [right], (C–F, H–L) or ordinary one-way analysis of variance (ANOVA) with Dunnett’s multiple comparisons test (B [left]) (A–F, H–L; error bars, standard deviaiton [SD] of biological replicates).

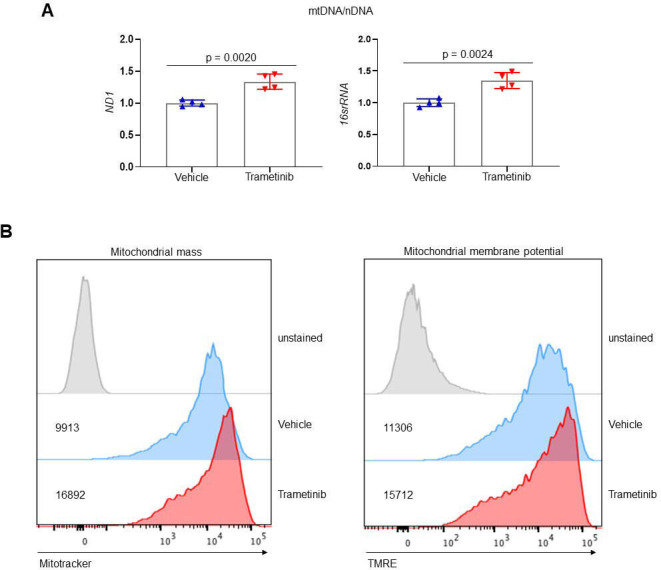
Figure 4—figure supplement 1. Extracellular signal-regulated kinase (ERK) inhibition enhances mitochondrial function in osteoblasts.

