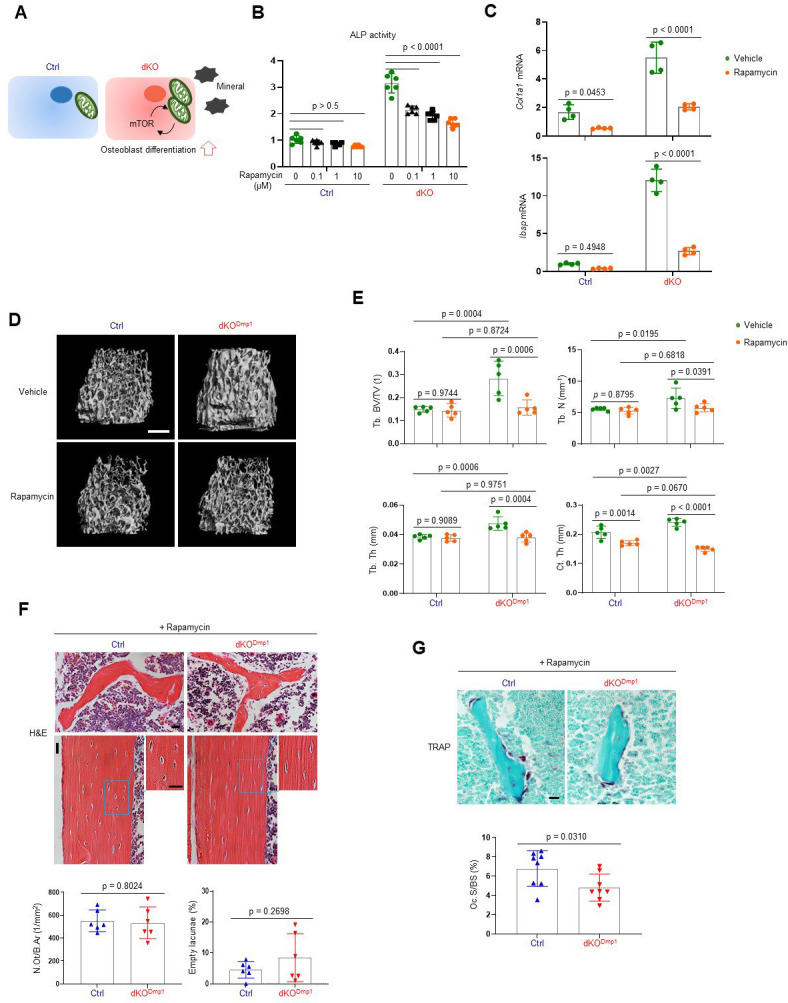
Figure 5. Rapamycin treatment reverses skeletal phenotypes of MEK1/2-deficient mice.
(A) Diagram showing the mechanisms by which extracellular signal-regulated kinase (ERK) inhibition enhances osteoblast differentiation due to augmented mechanistic target of rapamycin (mTOR)-mediated mitochondrial function. Ctrl and dKO Obs were treated with different doses of rapamycin under osteogenic conditions and 6 days later, alkaline phosphatase (ALP) activity (B) and osteogenic gene expression (C) were determined. (D, E) MicroCT analysis showing femoral bone mass in 8-week-old Ctrl and dKODmp1 mice treated with vehicle or rapamycin. 3D reconstruction (D) and the relative quantification (E) are displayed. Scale bar, 500 µm (D). (F) Hematoxylin and eosin (H&E)-stained longitudinal sections of 8-week-old Ctrl and dKODmp1 femurs treated with rapamycin. Representative images (top) and numbers of osteocytes/bone area (N.Ot/B.Ar) and empty lacunae (bottom) are displayed. Scale bar, 20 µm (top). (G) Tartrate-resistant acid phosphatase (TRAP)-stained longitudinal sections of 8-week-old Ctrl and dKODmp1 femurs treated with rapamycin. Representative images (top) and osteoclast surface/bone surface (Oc.S/BS) (bottom) are displayed. Scale bar, 20 µm (top). Data are representative of two or three independent experiments (B–D, F [top], G [top]) or pooled from two experiments (E, F [bottom], G [bottom]). Ordinary one-way analysis of variance (ANOVA) with Dunnett’s multiple comparisons test (B) or a two-tailed unpaired Student’s t-test for comparing two groups (C, E–G; B, C, E–G; error bars, standard deviation [SD] of biological replicates).

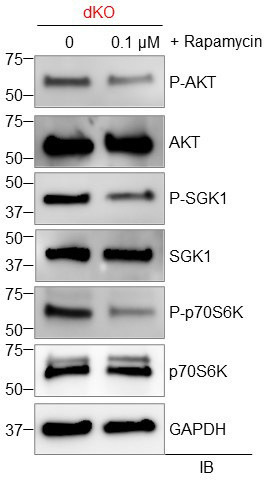
Figure 5—figure supplement 1. Rapamycin inhibits both mTORC1 and mTORC2 pathways.

