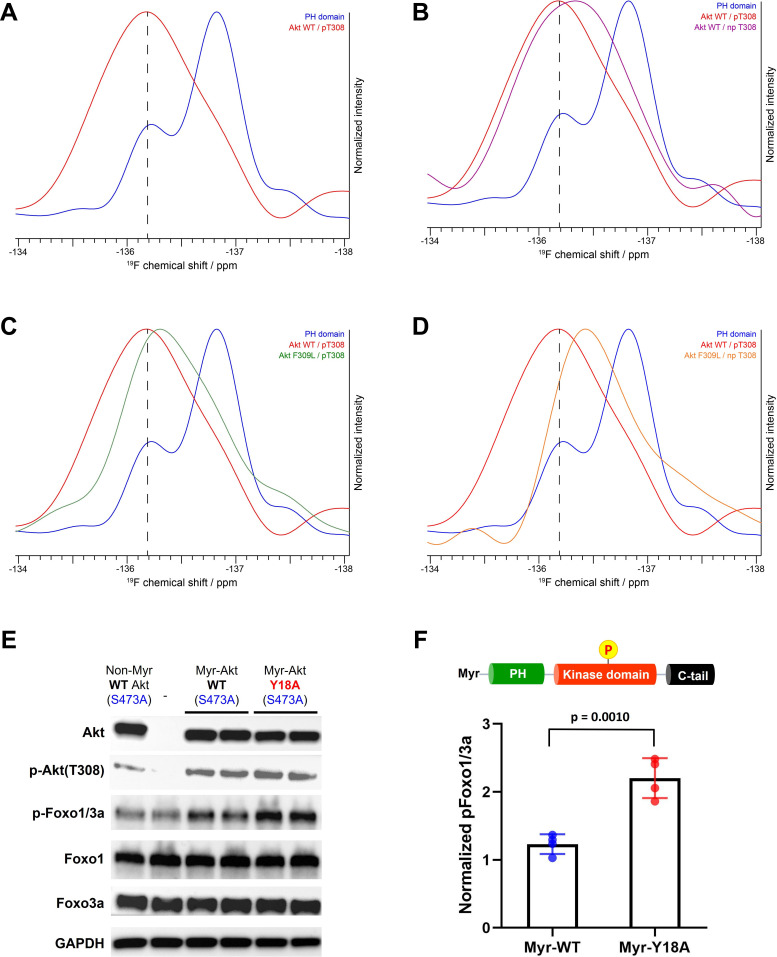
Figure 7. NMR analysis of fluoro-Tyr18-containing Akt forms and cellular assays on myristoylated Y18A Akt.
(A–D) 19F NMR spectra acquired on the isolated PH domain (blue), and full-length Akt WT (red) and F309L with pT308 (green), as well as full-length Akt WT (purple) and F309L with no pT308 (orange). The PH domain is specifically labeled with 19F at position 3 of Tyr18 aromatic ring and includes the R86A mutation. All spectra are normalized in intensity to the highest signal (major conformation in isolated PH domain). (E) Cellular analysis of the effects of Y18A mutation on Akt activity. Akt1/2 knockout HCT116 cells were transfected to express non-Myr WT Akt, myristoylated Akt (Myr-Akt) WT, or Myr-Akt Y18A mutant carrying an S473A mutation and then western blot analysis was done with Akt, Foxo1, and Foxo3a primary antibodies. (F) Quantified p-Foxo1/3a levels from cells expressing Myr-WT or Y18A Akt. The p-Foxo1/3a levels are normalized based on that of non-Myr WT Akt (n=4, SD shown).


