. 2020 Oct 20;2(12):5760–5768. doi: 10.1039/d0na00733a

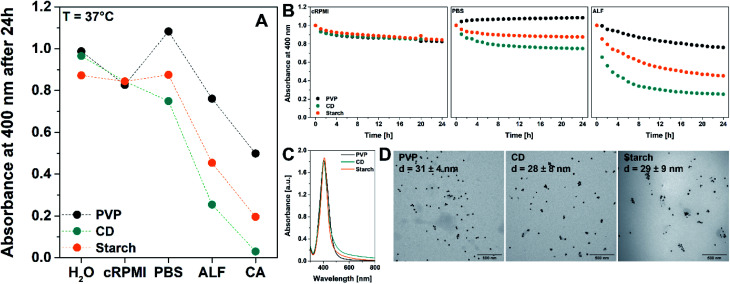
Fig. 1. (A) Dissolution of 30 nm AgNPs coated with PVP only (black dots), β-CD/PVP (CD, green dots), and starch/PVP (starch, orange dots) in water, cRPMI, PBS 1×, ALF 1× and 0.1 M CA at 37 °C after 24 h of incubation. Values were subtracted from the UV-Vis trends normalized to t0. (B) UV-Vis dissolution trends of AgNPs coated with PVP only (black dots), β-CD/PVP (CD, green dots), and starch/PVP (starch, orange dots) over 24 h at 37 °C in cRPMI, PBS 1× and ALF 1×. Measurements were carried out by recording the absorbance at 400 nm in one-hour intervals and normalising to t0. The corresponding results for water and CA are shown in Fig. S2. (C) UV-Vis spectra of the synthesised AgNPs and TEM micrographs (D). Scale bar: 500 nm. The diameter (d) represented in the images corresponds to the core diameter of the NPs. An enlarged view of the TEM images including histograms can be found in the ESI (Fig. S1).

Fig. 1