. 2020 Jul 27;2(9):3734–3763. doi: 10.1039/d0na00286k

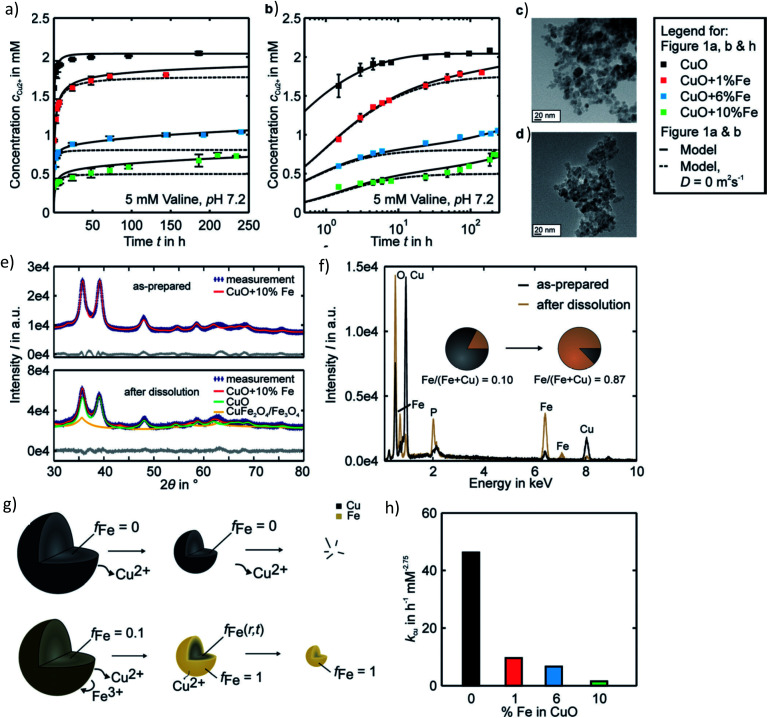
Fig. 4. Pharmacokinetics of Fe-doped CuO NPs as described by Naatz et al.79 (a and b) Cu2+ release profiles showing a slow long-term release in the case of the higher doped NPs in the logarithmic time scale. (c and d) TEM images of 10% Fe-doped NPs before and after dissolution in the span of 4 weeks. (e and f) Powder diffraction patterns and EDX spectra depicting the change in particle composition before and after dissolution of the 10%-doped CuO NPs. (g) Proposed two-step model of Fe-doped CuO NP dissolution wherein all the surface available Cu is first released until an Fe shell forms, followed by the solid-state diffusion of core Cu to the surface until all the particle Cu is removed. (h) Decrease in the dissolution rate constants with increasing Fe doping. This image has been reproduced with permission from Naatz et al.,79 © Wiley-VCH, 2020.

Fig. 4