. 2020 Aug 26;2(10):4777–4784. doi: 10.1039/d0na00635a

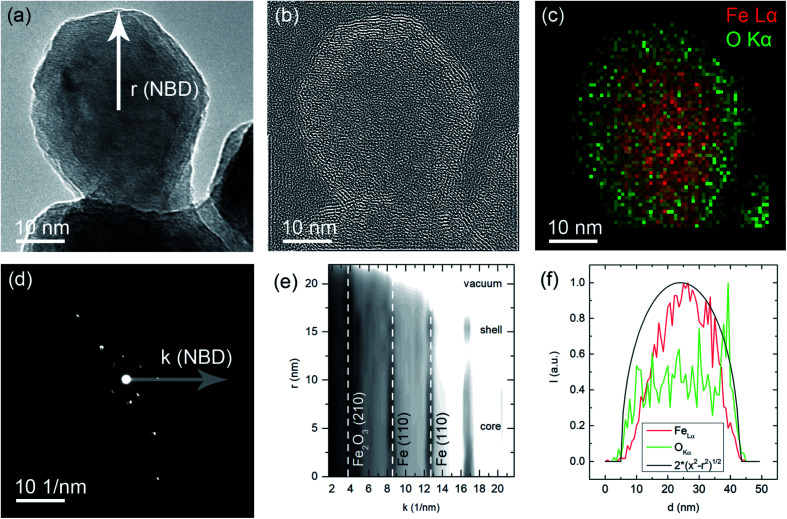
Fig. 7. (a) HRTEM image of a representative nanoparticle, the NBD scan direction is indicated originating at the center of the particle. (b) Bandpass/Fourier filtered image with the Fe2O3 (210) distance selected, note that this lattice spacing is only observed for the shell of the particle. (c) Color-coded EDS map of the particle (red: Fe–La, green O–K). (d) Exemplary NBD electron diffraction pattern with the radius in k-space indicated. (e) Intensity profile of rotational averaged NBD patterns recorded along the scan line indicated in (a). Note that for the center of the particle, the intensities of the Fe lattice spacings are prominent and for the edge/shell of the particle the Fe2O3 lattice spacings are stronger. (f) Line profiles of the characteristic line intensities plotted in (c). An ideal distribution for a homogeneous and spherical particle is also plotted.

Fig. 7