. 2020 Mar 31;2(5):2025–2033. doi: 10.1039/d0na00141d

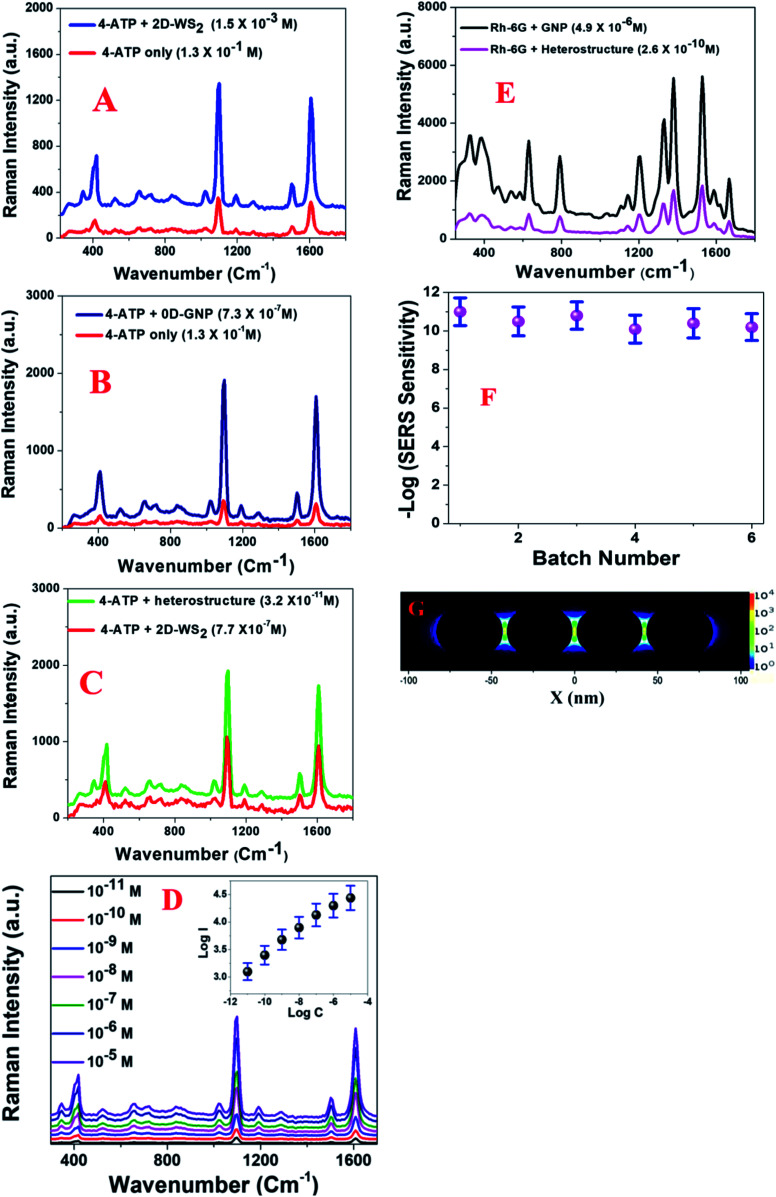
Fig. 2. (A) Plots showing how the Raman profile from 4-ATP varies in the presence of the 2D-WS2 surface and without any surface. To remove the Eg and A1g band contributions from WS2, we subtracted the Raman spectra of 4-ATP with the heterostructure SERS substrate from the spectrum of the heterostructure SERS substrate on its own. (B) Plots showing how the Raman profile from 4-ATP varies in the presence of the 0D-GNP surface and without any surface. (C) Plots showing how the Raman profile from 4-ATP varies in the presence of a heterostructure and GNP surface. (D) Plots showing how the Raman profile from 4-ATP varies with concentration in the presence of the heterostructure. The inserted plot shows how log(intensity at 1078 cm−1) varies with log(concentration of 4-ATP). (E) Plots showing how the Raman profile from Rh-6G varies in the presence of the heterostructure and the GNP surface. (F) A plot showing how log(Raman sensitivity) for 4-ATP varies between heterostructures made in different batches. (G) FDTD simulation data showing the electric field enhancement square (|E|2) profiles for a 0D-GNP assembly containing four nanoparticles.

Fig. 2