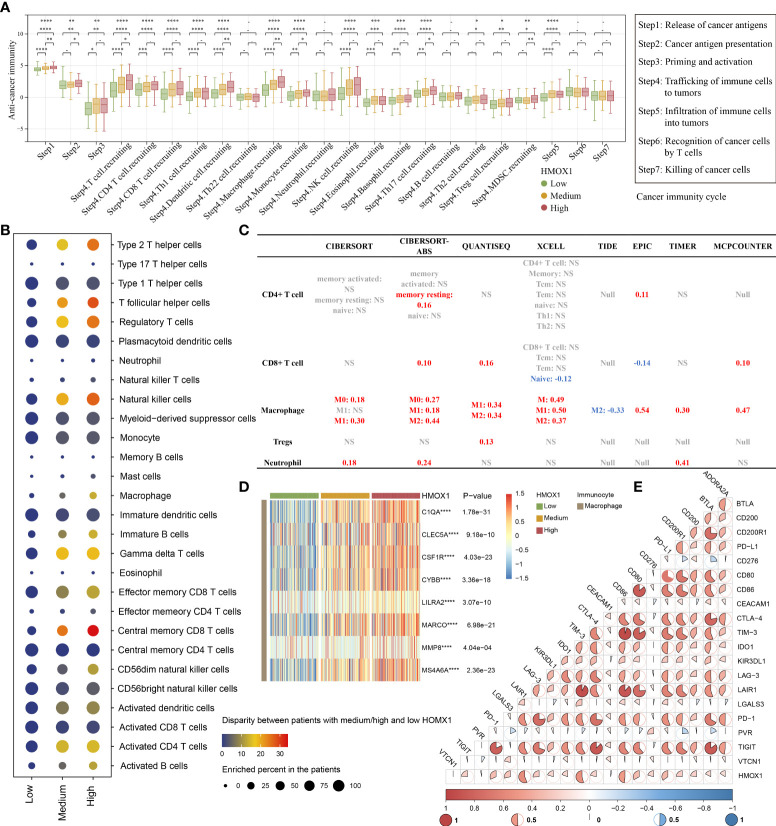
Figure 4.
The effect of HMOX1 on the immune microenvironment in LUAD. (A) Differences in multiple steps of the cancer immunity cycles between the high, medium, and low HMOX1 groups. (B) Differences in the infiltration levels of 28 types of immunocytes among the high, medium, and low HMOX1 groups, which were calculated using the GSEA algorithms. (C) Correlation between HMOX1 and the infiltration levels of 5 types of immunocytes (CD4+ T cells, CD8+ T cells, macrophages, Tregs, and neutrophils), which were calculated using 8 algorithms. (D) Differences in the effector genes of macrophages among the high, medium, and low HMOX1 groups. (E) Correlation between HMOX1 and 20 inhibitory immune checkpoints. NS, not significant; *P < 0.05; **P < 0.01; ***P < 0.001; ****P < 0.0001.

