. 2019 May 22;1(7):2681–2689. doi: 10.1039/c9na00143c

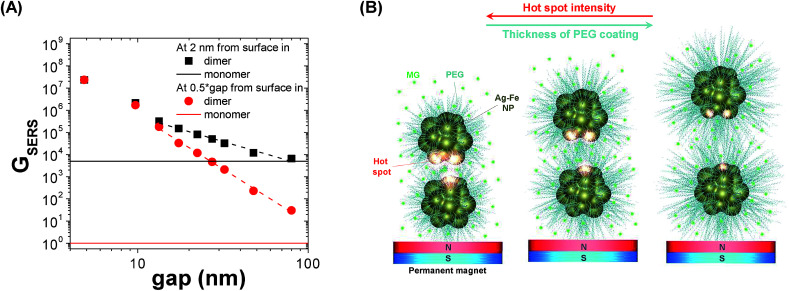
Fig. 4. (A) Logarithmic plot of maximum GSERS measured in the middle of the gap (red circles) or at a distance of 2 nm from the PEG-coated Ag–Fe NP surface (black squares) versus the dimer gap. Dashed lines are linear fit of the GSERS data in the 10–80 nm range. Horizontal continuous lines represent the maximum GSERS values at 2 nm (black) and at an infinite distance (red) from a single Au–Fe NP. (B) Schematic representation of hot-spot formation in PEG-coated Ag–Fe NPs when attracted by a permanent magnet in a liquid dispersion of MG: by reducing the thickness of the PEG layer, interparticle gap also decreases, and local field enhancement increases.

Fig. 4