. 2021 Feb 1;3(6):1758–1766. doi: 10.1039/d0na00787k

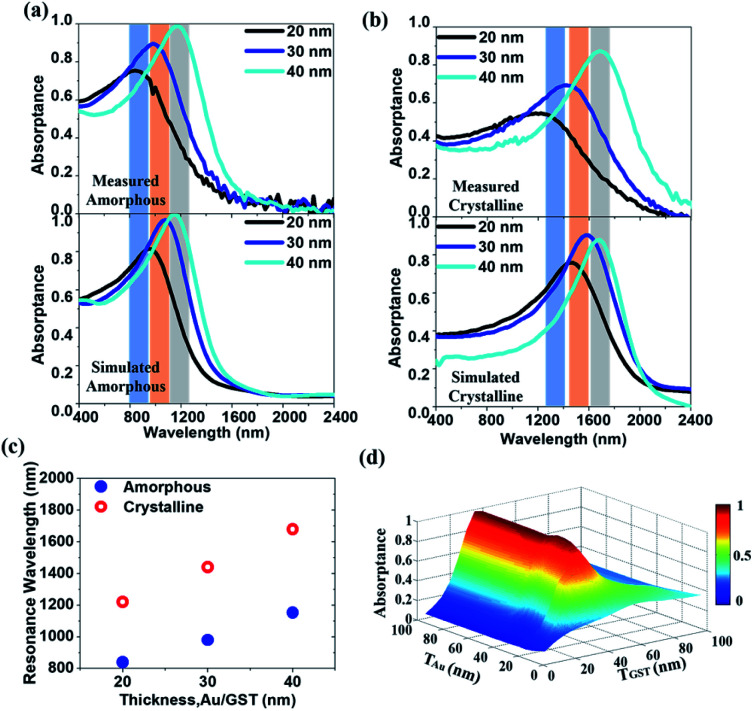
Fig. 3. (a and b) The performance of resonance switching in the HMM absorber: VASE measured (top panels) and FDTD simulated (bottom panels) absorptance spectra for the (a) amorphous and (b) crystalline states. The filling factor is f = 0.5 and the thickness of the constituent layer is TAu = TGST = 20 nm (black lines), 30 nm (blue lines), and 40 nm (cyan lines), respectively. The redshift of the absorptance spectra can be both experimentally and numerically found by changing the GST225 state from amorphous to crystalline. (c) The resonant wavelength is plotted against the thickness of constituent layers for both the amorphous (blue dot) and crystalline (red open circle) phases. (d) A 2D diagram of absorptance against TAu and TGST at a fixed wavelength of λa = 1180 nm.

Fig. 3