. 2021 Feb 12;3(6):1717–1724. doi: 10.1039/d0na00928h

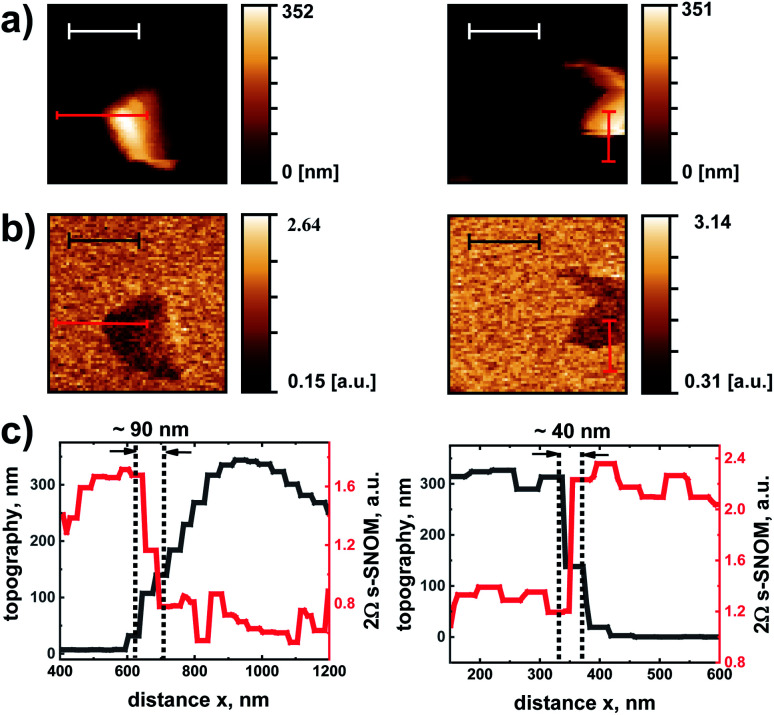
Fig. 8. (a) AFM-topography maps of two regions of a Si surface with dielectric islands on the sample (length of white scale bar: 1 μm). The line scans were taken with motion of the tip in horizontal direction and raster translation for each following scan in vertical direction. (b) Simultaneously recorded 2Ω s-SNOM images (length of black scale bar: 1 μm, tc = 61.15 ms). The measurements were made with the 180 nm detector. (c) AFM and 2Ω s-SNOM line profiles along the red lines shown in (a) and (b). The AFM data (with values on the left y-axis) are plotted in grey color, the 2Ω s-SNOM data (right y-axis) in red color. The width of the end bars of the red lines in the images shown in (a) and (b) indicate the spatial range over which the line-scan data of (c) were averaged. The vertical dotted black lines demarcate the distance range of the step-like change of the s-SNOM signal.

Fig. 8