. 2021 Feb 12;3(6):1717–1724. doi: 10.1039/d0na00928h

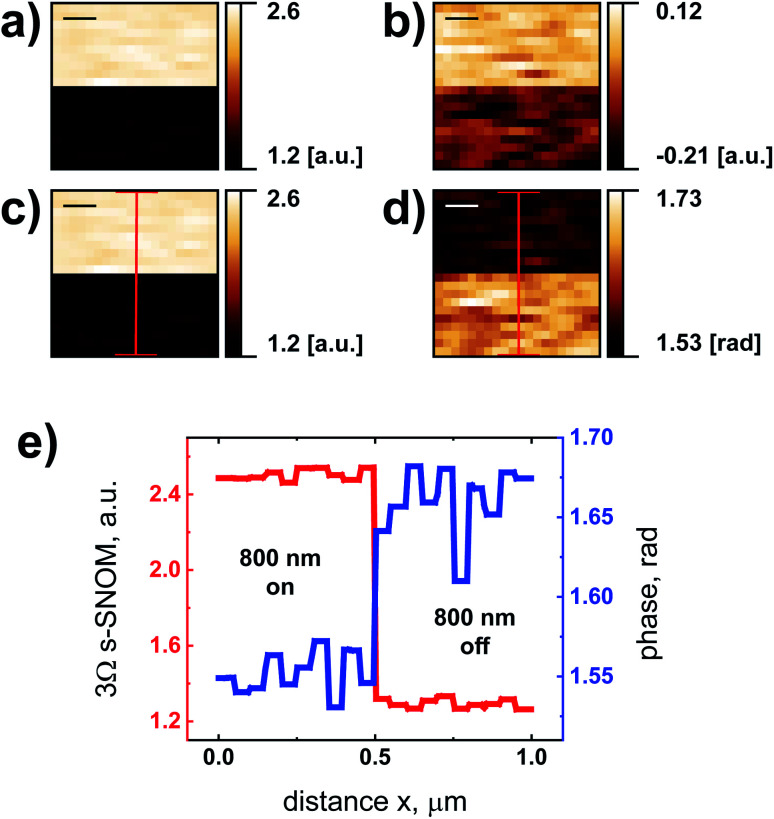
Fig. 9. (a and b) Consecutive 3Ω homodyne s-SNOM measurements at f = 246.5 GHz with shift of the reference phase by mirror displacement. After half of each areal scan, the exciting 800 nm laser light was blocked (top half of each panel in (a) to (d): light on; bottom half: light off). (c) Optical amplitude and (d) optical phase calculated from the raw data displayed in (a) and (b) (for details, see main text). (e) Line profiles across the near-field maps (along the red lines in (c) and (d)) reveal the measured amplitude and phase contrast. Scale bars: 200 nm, lock-in integration time: tc = 1 s, all measurements made with the 90 nm detector.

Fig. 9