. 2021 Feb 24;3(8):2325–2333. doi: 10.1039/d0na00985g

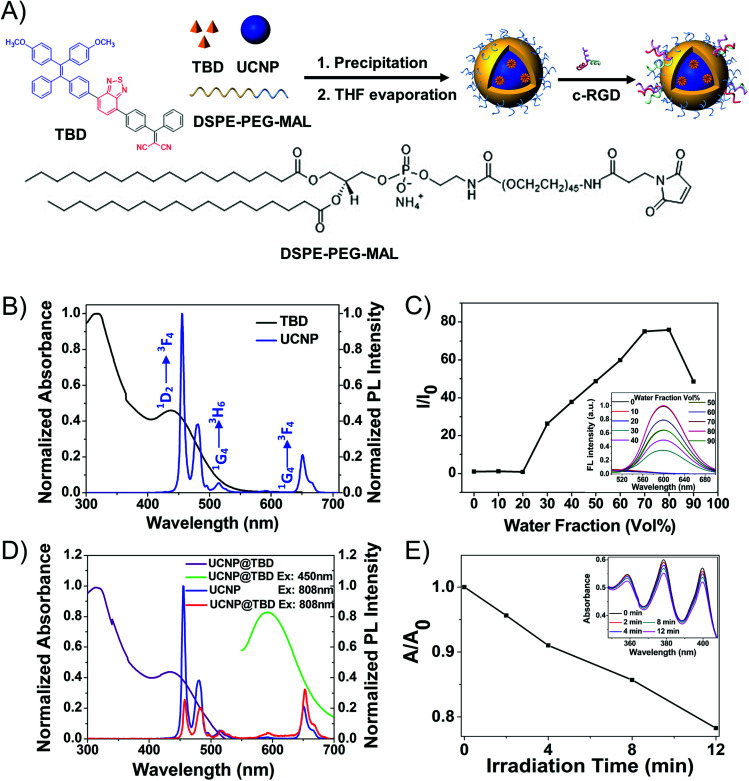
Fig. 1. (A) Synthesis of the UCNP@TBD nanocomposite. (B) Normalized UV-Vis absorption spectra of TBD dots ([TBD] = 13 μg mL−1) and PL spectra of UCNPs (Ex: 808 nm, 12.5 mW, [UCNPs] = 16 mg mL−1). (C) The changes in PL intensity of TBD in DMSO/water mixtures (Ex: 432 nm, [TBD] = 30 μg mL−1) with different water fractions in the same total volume. The inset shows the PL spectra of TBD in different water fraction solvents. (D) Normalized UV-Vis absorption spectra of UCNP@TBD nanocomposite ([nanocomposite] = 13 μg mL−1 based on TBD) and normalized PL spectra of UCNPs (Ex: 808 nm, 12.5 mW, [UCNPs] = 16 mg mL−1) and UCNP@TBD nanocomposite (Ex: 450 nm, 10 mW, [nanocomposite] = 13 μg mL−1 based on TBD; Ex: 808 nm, 12.5 mW, [nanocomposite] = 3.5 mg mL−1 based on UCNP). (E) The changing curve of the characteristic absorption peak (378 nm) of ABDA when the mixture solution of UCNP@TBD nanocomposite ([nanocomposite] = 13 μg mL−1 based on TBD) and ABDA (0.05 mM) was irradiated with NIR light (808 nm, 200 mW cm−2) for different times. The measured UV-Vis absorption spectra are shown in the inset.

Fig. 1