
Fig. 2. DNA-induced liquid phase separation of cGAS in cells.
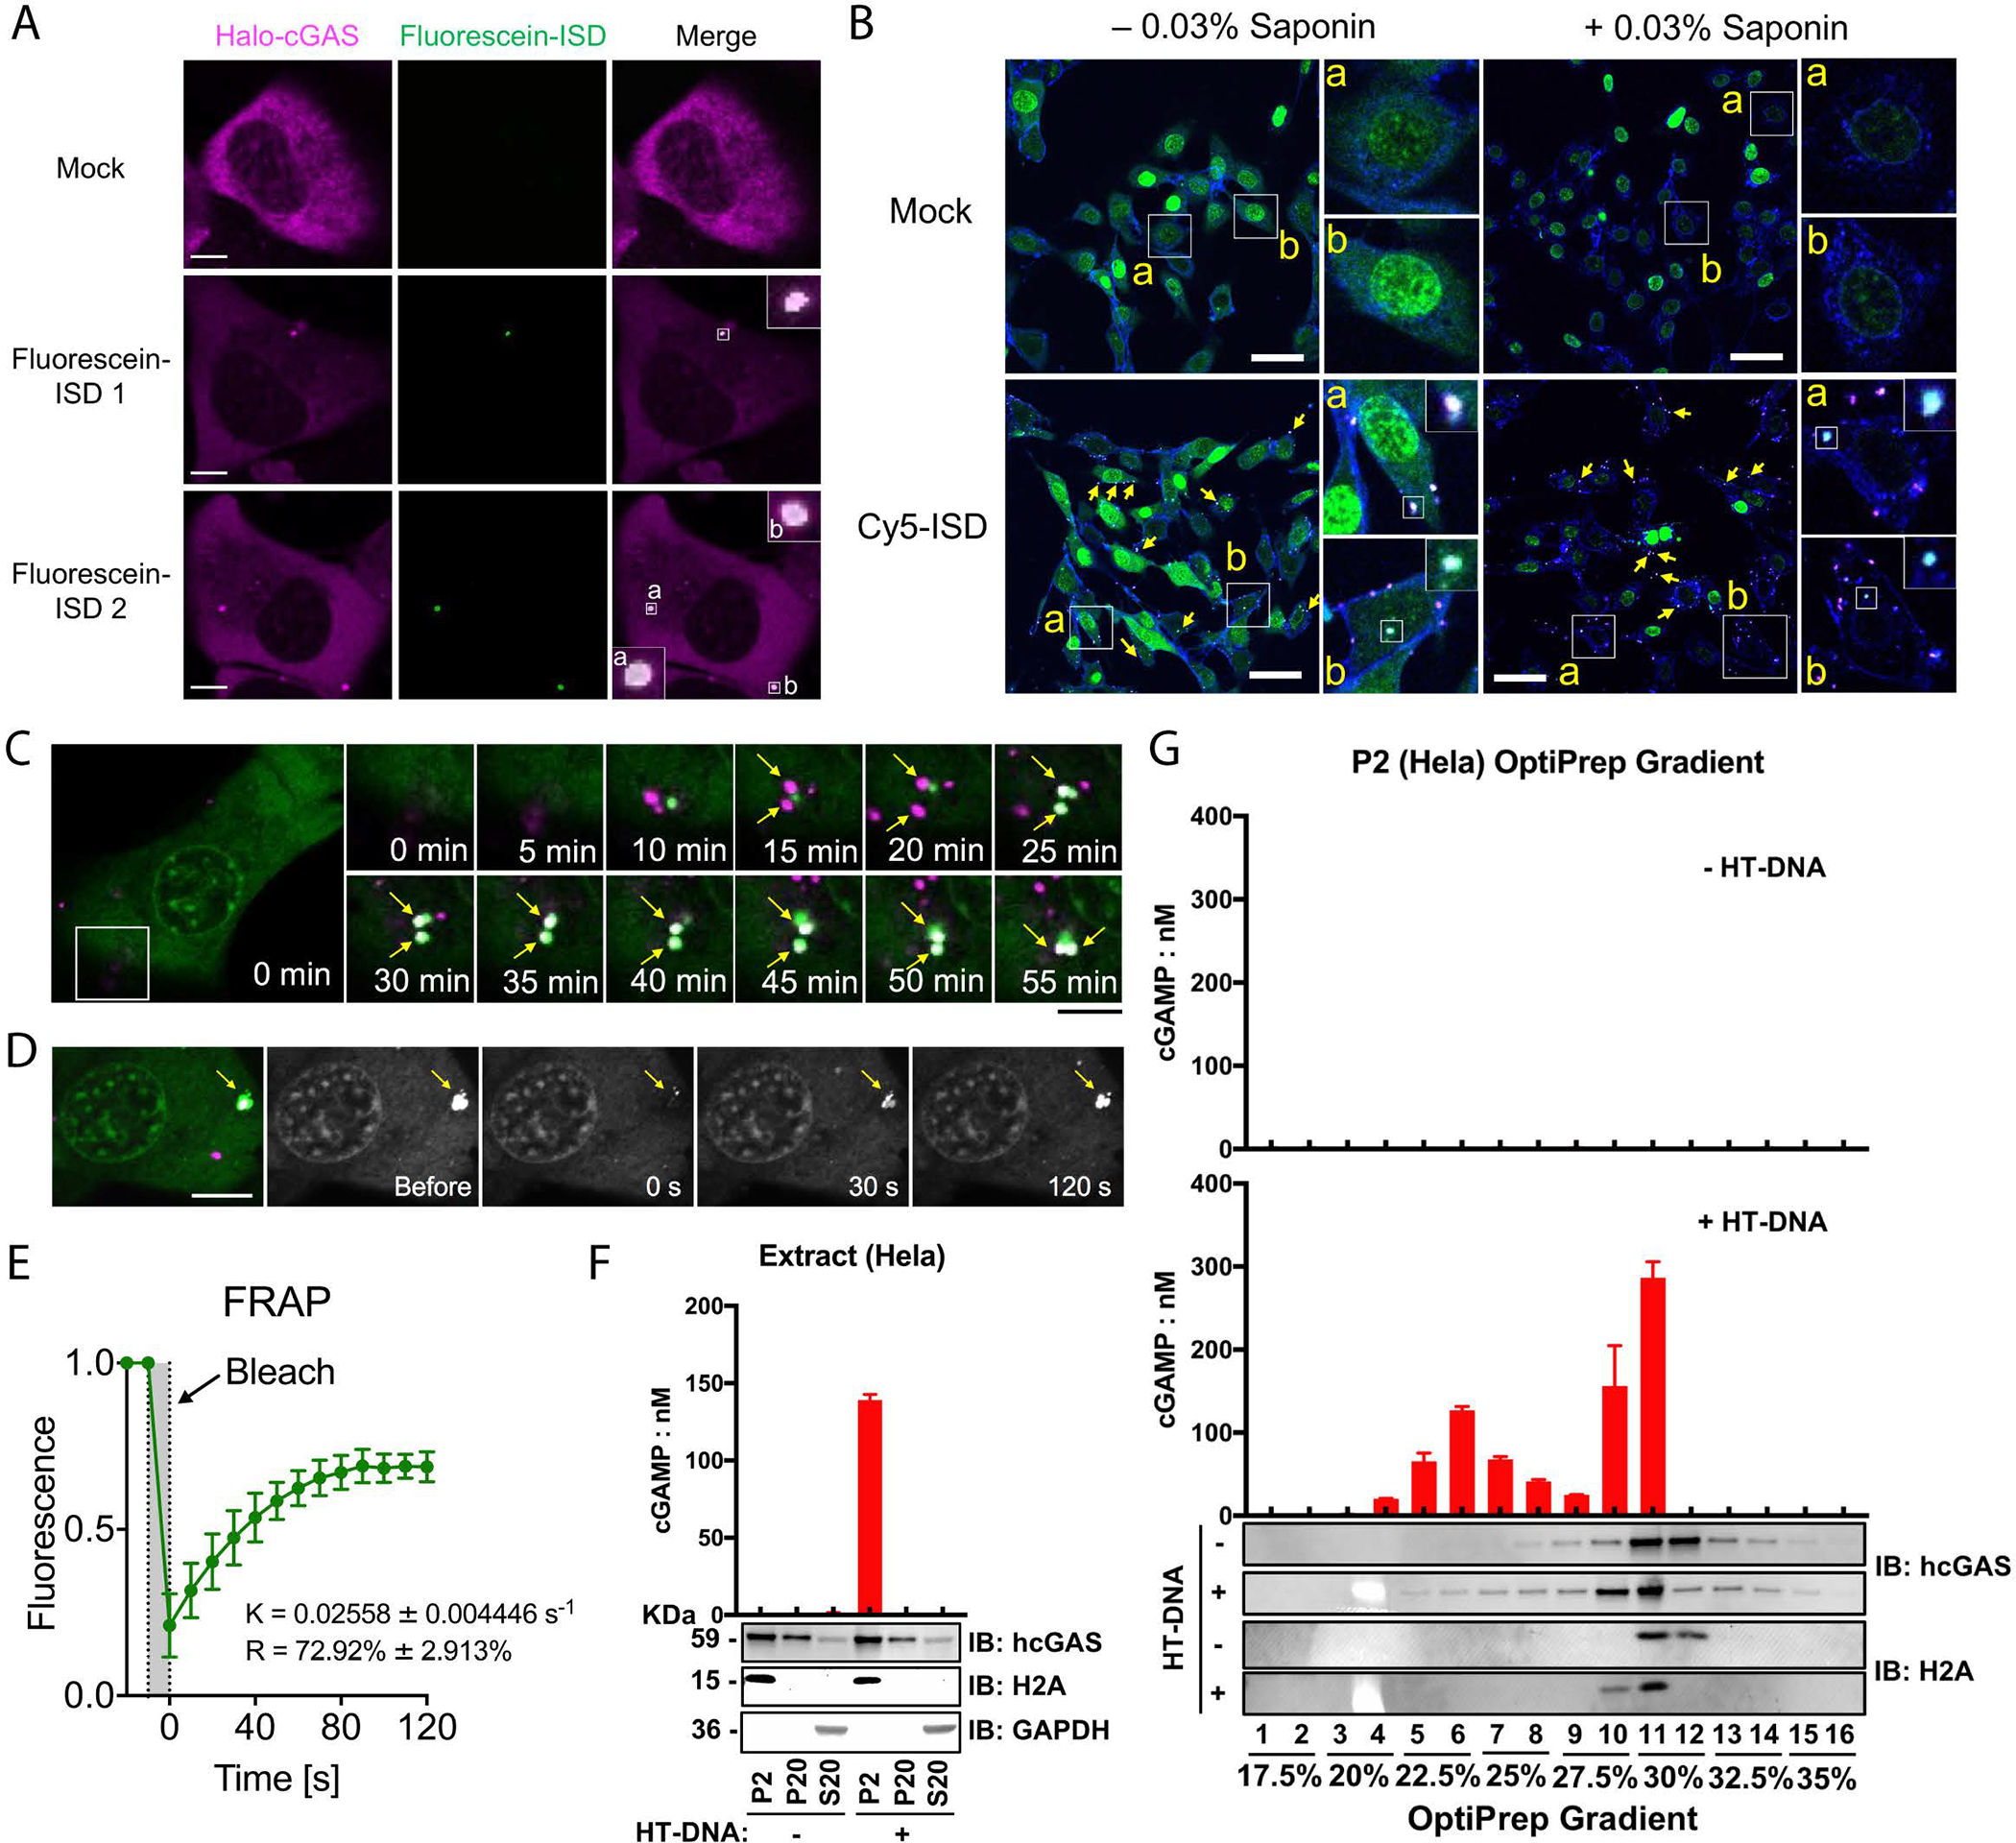
(A) Representative live cell images of cGAS–DNA puncta formation after transfection of fluorescein-ISD into BJ cells stably expressing Halo-cGAS, which was covalently labeled with TMR. Zoomed images indicate cGAS–DNA puncta (Boxes). Scale bar: 10 μm. These images are representative of at least 10 cells. (B) MEF cells stably expressing GFP–cGAS were transfected with Cy5-ISD for 4 hours, followed by permeabilization of the cells with saponin and fluorescence microscopy. Shown in blue is the plasma membrane marker wheat germ agglutinin. Scale bar: 50 μm. These images are representative of at least 5 fields examined. (C) Time-lapse micrographs of cGAS (green) and DNA (magenta) puncta formation and fusion (time 0 represents 30 min after Cy5-ISD45 transfection). Scale bar: 15 μm. The fusion events existed in all 8 fields examined. (D) Representative micrographs of cGAS–DNA puncta before and after photobleaching (arrow, bleach site). Scale bar: 15 μm. These images are representative of at least 3 cells in which the cGAS–DNA puncta were photobleached. (E) Quantification of cGAS–DNA puncta FRAP over a 120-second time course. K: exponential constant. R: normalized plateau after fluorescence recovery. Shown are means ± SD. N = 3 cGAS–DNA puncta. (F) Subcellular fractionation of cGAS activity in DNA-transfected cells. HeLa cells transfected with or without HT-DNA were fractionated by differential centrifugation as depicted in Fig. S4B. Fractions were incubated with ATP and GTP followed by measurement of cGAMP. Fractions were also analyzed by immunoblotting with antibodies against histone H2A (nuclear marker), GAPDH (cytoplasmic marker), or cGAS. (G) The P2 fractions from (F) were further separated by Optiprep gradient ultracentrifugation and cGAS activity in different fractions were measured as in (F). Fractions from cells not transfected with DNA had no cGAS activity (upper panel). Error bars in (F) and (G) represent the variation range of duplicate assays. Data are representative of at least three independent experiments.