
Fig. 4. Zinc ion promotes DNA-induced phase separation and activation of cGAS.
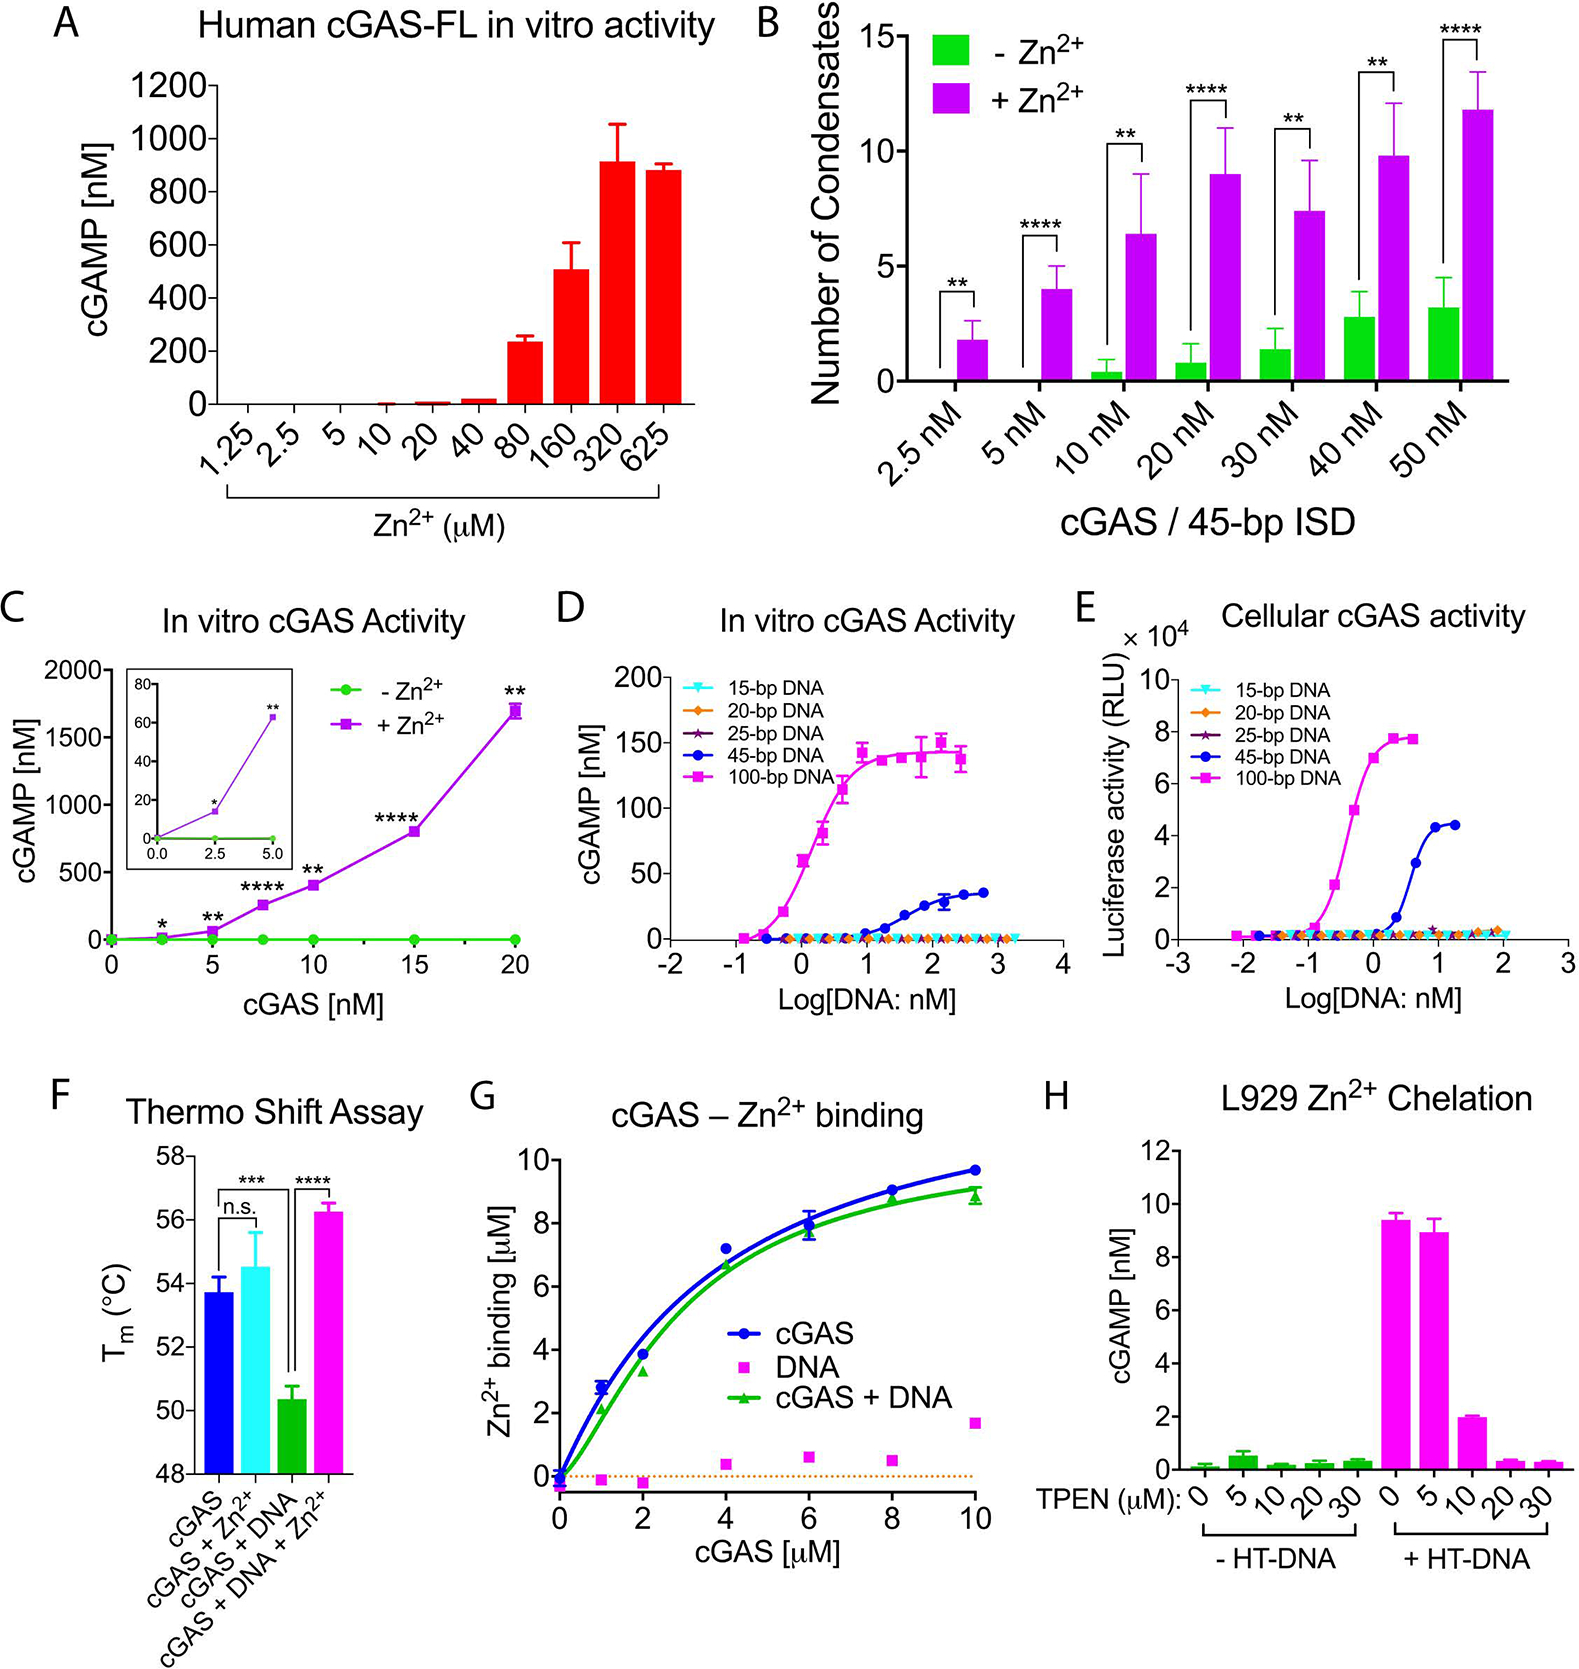
(A) Zn2+ enhances cGAS activation in vitro. Recombinant human full-length cGAS (15 nM) was incubated with ATP, GTP, and DNA in a physiological buffer containing indicated concentrations of Zn2+, followed by measurement of cGAMP production. (B) Quantification of cGAS–DNA condensates in the presence or absence of zinc. Liquid-phase condensates formed after mixing Alexa Fluor 488-labeled full-length human cGAS with 45-bp Cy3-labeled ISD at indicated concentrations of each in physiological buffer with or without Zn2+ (200 μM). Images were then captured by confocal microscopy and representative images are shown in Figure S7D. Values are means ± SD. N = 5 images. Multiple t tests. (C) cGAMP production in physiological buffer containing HT-DNA and different concentrations of cGAS in the presence or absence of Zn2+ (200 μM). The activity of cGAS at low concentrations is shown in the inset. Multiple t tests. (D) cGAMP production by 10 nM cGAS in physiological buffer containing 200 μM Zn2+ and different concentrations of DNA of indicated lengths. (E) THP1-Lucia ISG cells, which harbor a luciferase gene under the ISG54 promoter, were transfected with indicated DNA for 24 hours followed by measurement of the secreted luciferase activity. RLU: relative luciferase unit. (F) Thermo shift assay to measure the stability of cGAS or cGAS–DNA complex in the presence or absence of Zn2+ (200 μM). Tm: protein melting temperature. Values are means ± SD. N = 3. Unpaired t test. (G) Measurement of cGAS binding to zinc. Zinc ion (10 μM) was incubated with various concentrations of DNA, cGAS, or both, and the solution was passed through a centrifugal filter, followed by measuring zinc ion concentration in the filtrate. The Kd values of zinc binding to cGAS and cGAS–DNA complex were 3.9 ± 1.3 μM and 3.0 ± 0.4 μM, respectively. (H) Depletion of intracellular zinc inhibits cGAS activation by DNA. L929 cells were incubated with the indicated concentrations of Zn2+ chelator TPEN for 2 hours before transfection with HT-DNA. cGAMP production was measured by a bioassay. Images of intracellular zinc depletion are shown in Figure S8B p values for B, C and F: > 0.0332 (n.s.), 0.0332 (*), 0.0021 (**), 0.0002 (***), < 0.0001 (****). Error bars represent the variation range of duplicate assays unless indicated otherwise. Data are representative of at least three independent experiments.