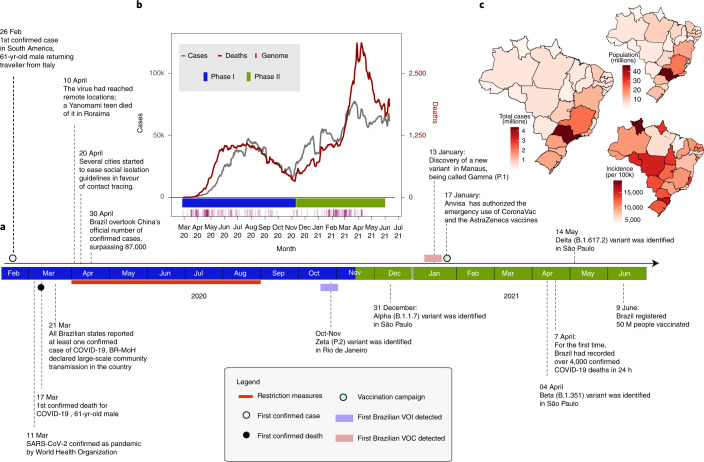
Fig. 1. Key events after the first confirmed SARS-CoV-2 infection in Brazil.
a, Timeline of SARS-CoV-2 key events in Brazil. b, Epidemic curve showing the progression of reported daily viral infection numbers in Brazil from the beginning of the epidemic (grey) and deaths (red) in the same period, with restriction phases indicated by the horizontal bar at the bottom. c, Map of cumulative SARS-CoV-2 cases per 100,000 inhabitants in Brazil up to June 2021.

