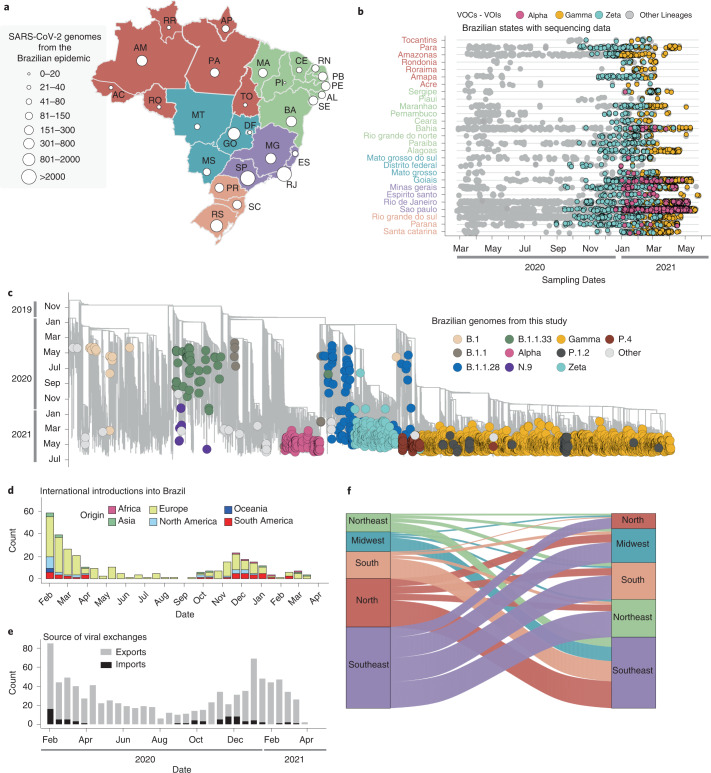
Fig. 2. Phylogenetic analysis and SARS-CoV-2 lineage dynamics in Brazil.
a, Map of Brazil with the number of sequences in GISAID as of 30 June 2021. The map is coloured according to geographical macro region: North (red), Northeast (green), Southeast (purple), Midwest (light blue) and South (light orange). AC, Acre; AL, Alagoas; AP, Amapá; AM, Amazonas; BA, Bahia; CE, Ceará; DF, Distrito Federal; ES, Espírito Santo; GO, Goiás; MA, Maranhão; MT, Mato Grosso; MS, Mato Grosso do Sul; MG, Minas Gerais; PA, Pará; PB, Paraíba; PR, Paraná; PE, Pernambuco; PI, Piauí; RR, Roraima; RO, Rondônia; RJ, Rio de Janeiro; RN, Rio Grande do Norte; RS, Rio Grande do Sul; SC, Santa Catarina; SP, São Paulo; SE Sergipe; TO, Tocantins. b, Temporal sampling of sequences in Brazilian states through time with VOCs highlighted and annotated according to their PANGO lineage assignment. c, Time-resolved maximum-likelihood phylogeny containing high-quality near-full genome sequences from Brazil (n = 3,866) obtained from this study, analysed against a backdrop of global reference sequences (n = 25,288). VUMs and VOCs are highlighted on the phylogeny. d, Sources of viral introductions into Brazil characterized as external introductions from the rest of the world. e, Sources of viral exchanges (imports and exports) into and out of Brazil. f, Number of viral exchanges within Brazilian regions by counting the state changes from the root to the tips of the phylogeny in c.

