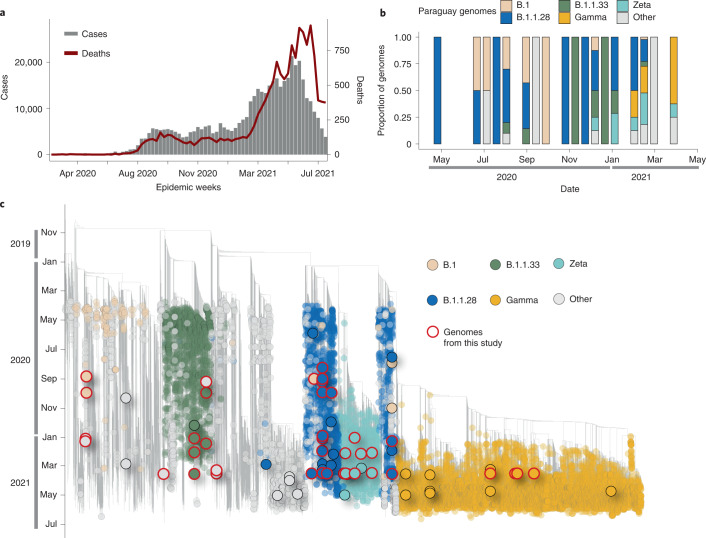
Fig. 5. The SARS-CoV-2 epidemic in Paraguay.
a, Epidemic curve showing the progression of reported viral infection numbers in Paraguay from the beginning of the epidemic (grey) and deaths (red) in the same period. b, Progressive distribution of the top 20 PANGO lineages in Paraguay over time. c, Time-resolved maximum-likelihood tree containing high-quality near-complete genome sequences from Paraguay (n = 63) obtained in this study, analysed against a backdrop of global reference sequences. VUMs and VOCs are highlighted on the phylogeny. Genome sequences from Paraguay obtained in this study are highlighted with red borders.

