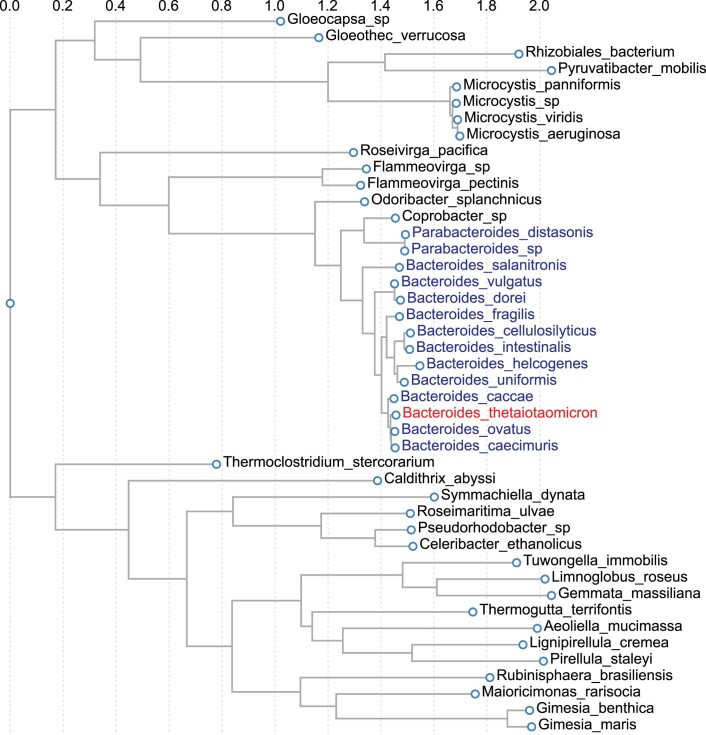
Extended Data Fig. 7. Phylogenetic tree representing organisms which contain Bt_0416 or Bt_0416-like genes.
Red highlights Bt_0416 and blue highlights others Bacteroides species. The BLASTP analysis was performed using the KEGG BLAST tool with the top 50 resulted selected and subjected to the TREE function. Sequences were aligned using MAFFT and phylogenetic inferences were obtained using the maximum likelihood method within the tool. Scale denoted on the top of the plot indicates the nucleotide sequence divergence.

